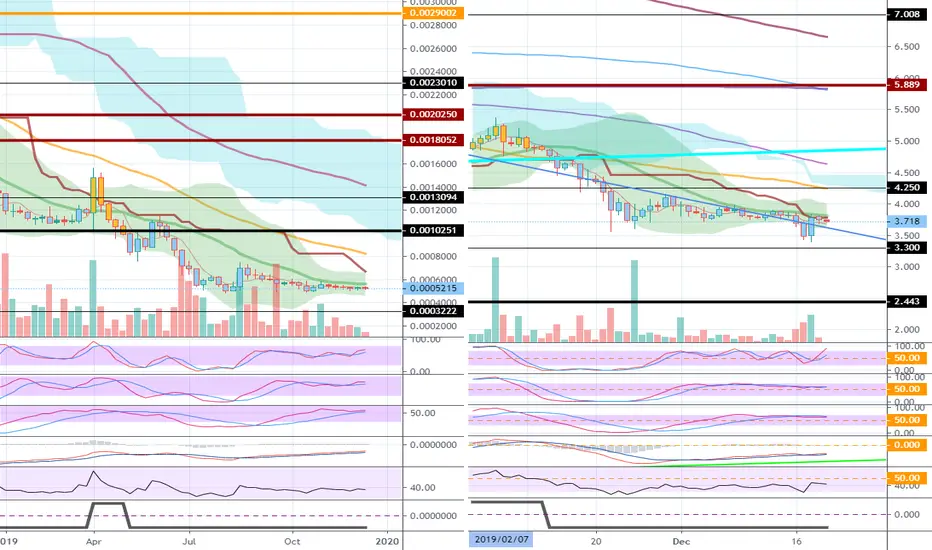
On the ETCBTC chart,
Below 0.0010251 is a long-term investment area.
In the ETCUSD chart,
It is moving around the downtrend line.
You should check if you can move outside of the downward trend line.
----------------
It is expected to take a long time to raise prices in the normal market flow.
Below 0.0010251 is a long-term investment area.
In the ETCUSD chart,
It is moving around the downtrend line.
You should check if you can move outside of the downward trend line.
----------------
It is expected to take a long time to raise prices in the normal market flow.
Other content (coins, stocks, etc.) is frequently posted on X.
X에 다른 내용(코인, 주식 등)이 자주 게시.
◆ t.me/readCryptoChannel
[HA-MS Indicator]
bit.ly/3YxHgvN
[OBV Indicator]
bit.ly/4dcyny3
X에 다른 내용(코인, 주식 등)이 자주 게시.
◆ t.me/readCryptoChannel
[HA-MS Indicator]
bit.ly/3YxHgvN
[OBV Indicator]
bit.ly/4dcyny3
Related publications
Disclaimer
The information and publications are not meant to be, and do not constitute, financial, investment, trading, or other types of advice or recommendations supplied or endorsed by TradingView. Read more in the Terms of Use.