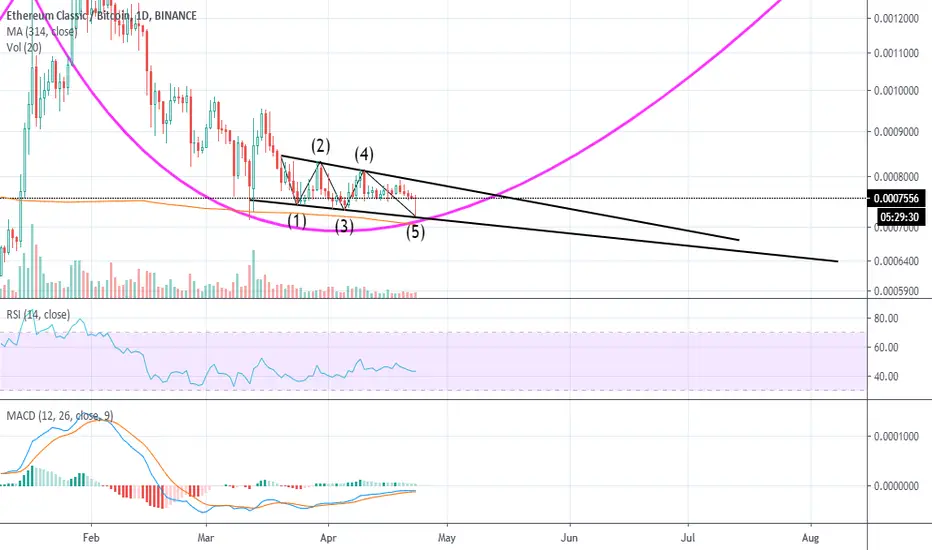
By looking at the chart we can notice a couple of important things:
1) there is a descending channel with 5 waves
2) there is clear bullish divergence
3) formation of dragonfly doji candle on the daily
These are clearly bullish signs. If etc picks momentum the price could skyrocket from here. Especially if it touches that upper resistance line ( the neckline of the big inverse head and shoulders not shown on the chart). This could eventually result in being one of the lowest entry points for ETC.
As usual this is just for educational purpose, good luck with your trades!
Note
If it happens that we break up to the upside with momentum, there is a high chance of completing the inverse head and shoulders:Disclaimer
The information and publications are not meant to be, and do not constitute, financial, investment, trading, or other types of advice or recommendations supplied or endorsed by TradingView. Read more in the Terms of Use.
Disclaimer
The information and publications are not meant to be, and do not constitute, financial, investment, trading, or other types of advice or recommendations supplied or endorsed by TradingView. Read more in the Terms of Use.