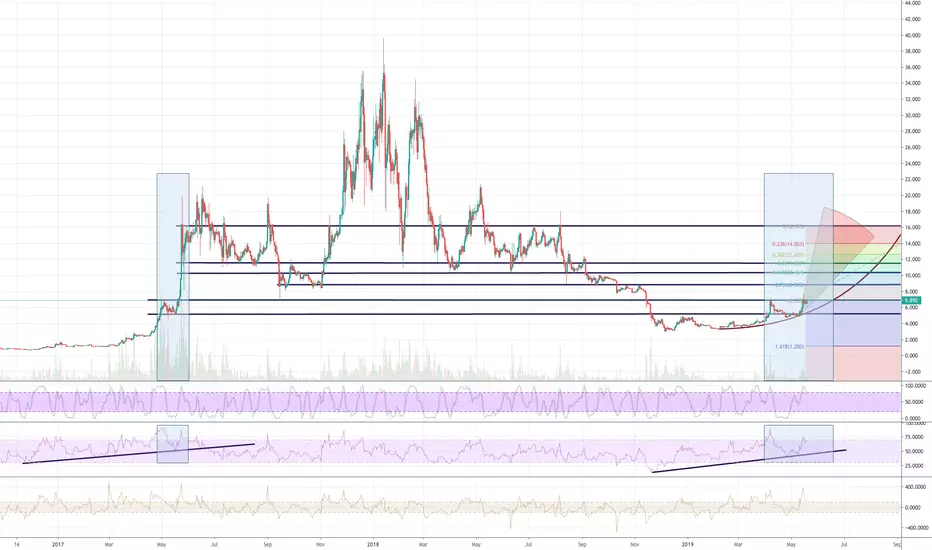
Looking at the chart now and how it behaved prior to the 2017 boom, you'll find a lot of similarities. If ETC does follow it's previous path, we can expect a significant upwards movement in the coming days (probably around May 21-25).
Best-case scenario = 16 EUR
Semi-best case scenario = around 13 EUR
Worst-case scenario = 9-10 EUR
RSI , MACD & Fab all show similar signes as well.
Let's see what will happen :D
Best-case scenario = 16 EUR
Semi-best case scenario = around 13 EUR
Worst-case scenario = 9-10 EUR
RSI , MACD & Fab all show similar signes as well.
Let's see what will happen :D
Note
Sorry off by 2 days... but here we go :D Next stop... m00nNote
CUP & HANDLE clearly visible now...Note
Note
As expected... here we go...Big resistances @ 8 EUR and 9.50 EUR
Note
Sorry my bad... resistances:- 8.00 EUR
- 8.37 EUR
- 9.42 EUR
- 10.77 EUR
- 12.36 EUR
We might see 9:42 pretty soon, perhaps even by sunday. 12.36 + (unless ETC goes mad) might take a bit longer. But with the Atlantis fork schedules for mid september we might see a significant boost in June/July
Note
Perfect time to buy some more :D Will go down a bit more but should recovery by tomorrow. Especially, since EOS will have its big day tomorrow. Check the MACD to se when things will improve. Note
All good... 200 MA & 50 MA just crossed (golden cross). Everything going as expected and shown in the first picture. Compare for yourself. Disclaimer
The information and publications are not meant to be, and do not constitute, financial, investment, trading, or other types of advice or recommendations supplied or endorsed by TradingView. Read more in the Terms of Use.
Disclaimer
The information and publications are not meant to be, and do not constitute, financial, investment, trading, or other types of advice or recommendations supplied or endorsed by TradingView. Read more in the Terms of Use.