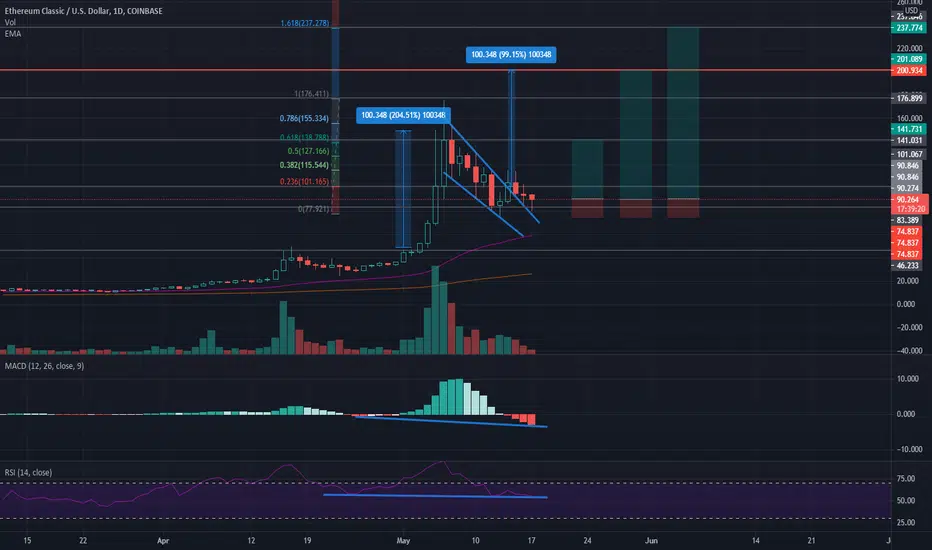
Breakout and backtest complete, higher low and Hidden Bullish Divergence on daily timescale. Dropping volume on the way down adds to sellers' exhaustion argument. Targets: top of the structure, measured move confluent with psychological resistance and 1.618 fib level. By far my favorite crypto chart right now, showing very similar set of variables to BCH trade that got us 100% returns 2 weeks ago.
Trade active
Note
Unfortunate price action on BTC affecting this trade obviously. 42k is a major congestion area of historical support/resistance (January, February), fib retracement nodes and close to psychological support around 40k so I hope it will hold for a couple of days and ETC should be able to recover when Bitcoin goes sideways.Note
Just look how strong it is compared to other alts that usually have similar correlation with BTC price movement. ETH, LTC, BCH all just made a lower low compared to their yesterday's bottom as BTC tested 42k again but ETC actually made a higher low at the same time. Statement to how bullish this asset is despite overall market weakness, it just needs BTC to stabilize for a while to play out.Note
BTC attempting double bottom in 42k range, bullish divergence on 1h. This zone is where a bounce or consolidation could very likely occur. Also pattern completion zone of bullish shark harmonics pattern with target above 53k. Should this play out on BTC, ETC will have no choice but to run much higher.Note
Mixed feelings about this chart right now. Lower low on 4h is not good but we're still above that Falling Wedge we are trying to trade here and if BTC could just calm down for a day or two this could very well still play out. Everything riding on Bitcoin stabilizing though. I'd like to see a daily close above 39.5k (200 daily moving average) on BTC but so far it's uncertain if it can hold that level.Trade closed: stop reached
Unfortunately stopped out due to broader market correction. Still the chart looks amazing compared to most other cryptos. Higher low on the daily and holding above historical support around $50. When some kind of bounce/relief rally finally happens in crypto space I think this could appreciate in value a lot but that original $200 target and trade idea are unfortunately invalidated now so we would need to look for a new entry and new price targets, probably closer to $100.Disclaimer
The information and publications are not meant to be, and do not constitute, financial, investment, trading, or other types of advice or recommendations supplied or endorsed by TradingView. Read more in the Terms of Use.
Disclaimer
The information and publications are not meant to be, and do not constitute, financial, investment, trading, or other types of advice or recommendations supplied or endorsed by TradingView. Read more in the Terms of Use.