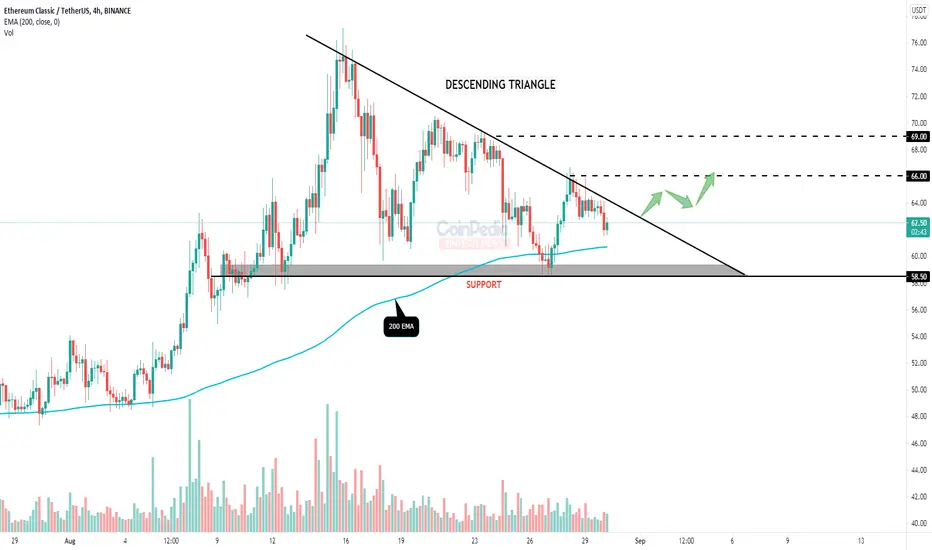
* Ethereum classic in 4H time frame forms a descending triangle with it's support near $58.5 and the above trend-line as it's resistance.
* The 200 EMA ( Exponential moving average ) is working as support for the price.
* If the price breaks the upper trend-line (resistance) we can expect a bullish move till $69.
* ETC is bearish below it's support zone.
* The 200 EMA ( Exponential moving average ) is working as support for the price.
* If the price breaks the upper trend-line (resistance) we can expect a bullish move till $69.
* ETC is bearish below it's support zone.
Trade closed: target reached
Disclaimer
The information and publications are not meant to be, and do not constitute, financial, investment, trading, or other types of advice or recommendations supplied or endorsed by TradingView. Read more in the Terms of Use.
Disclaimer
The information and publications are not meant to be, and do not constitute, financial, investment, trading, or other types of advice or recommendations supplied or endorsed by TradingView. Read more in the Terms of Use.