ETC / USD
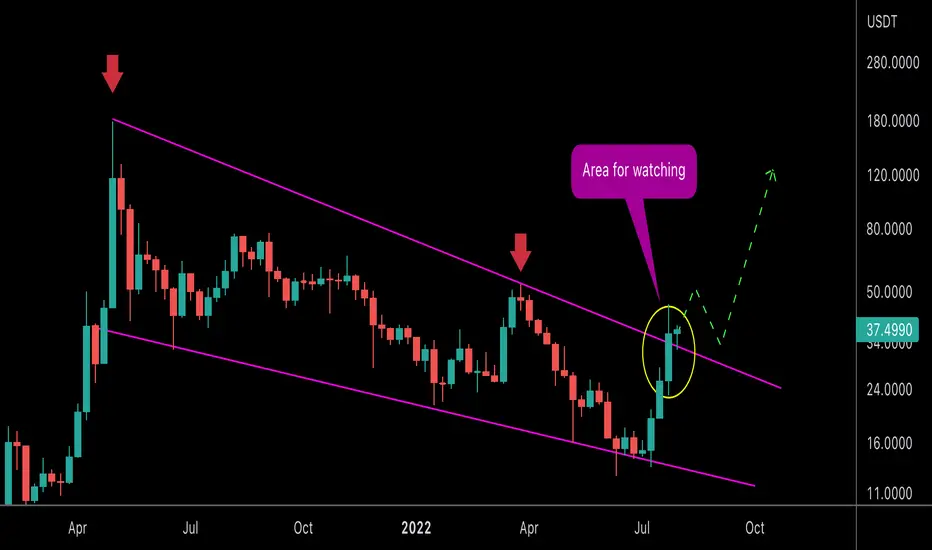
Multiple attempts to break the major resistance on high time frames
The yellow area marked in my chart is very important for watching to see how the price action will play out
-If bulls cleared the resistance with weekly candle close above trendline this will be a sign of strong bullish wave coming in next days/weeks
-If a weekly candle closed with bearish engulfment the bullish view will be invalidated… so lets see how the bulls will act here
📈Telegram channel: t.me/bitcoin_masters
💎For Premium Signals Group ask me here: t.me/Babenski
💎For Premium Signals Group ask me here: t.me/Babenski
Disclaimer
The information and publications are not meant to be, and do not constitute, financial, investment, trading, or other types of advice or recommendations supplied or endorsed by TradingView. Read more in the Terms of Use.