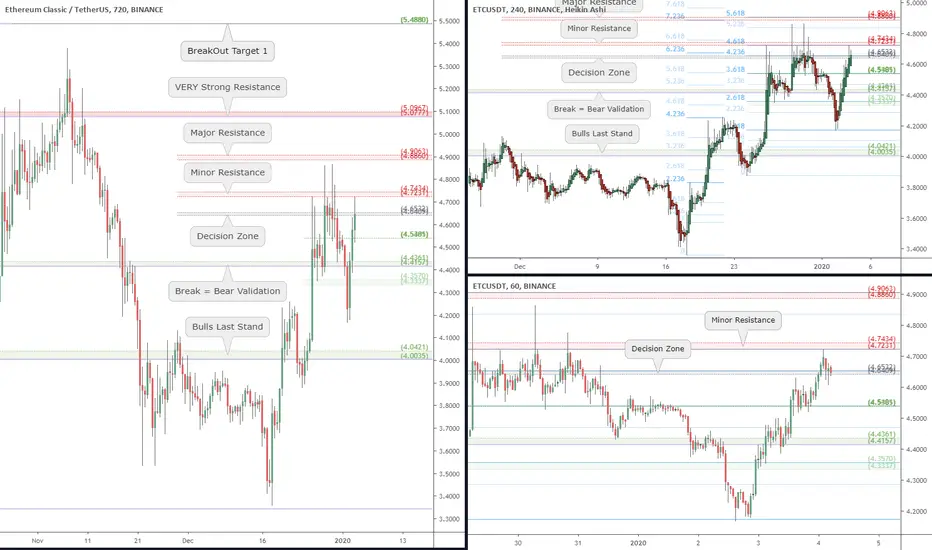
ETC plot to map nearby Support and Resistance Zones.
It has enjoyed much buoyancy even while BTC was diving.
Now it is at first of three progressively stronger resistances.
The bounce thus far looks "Corrective" more so than "Impulsive".
Corrective as in overlapping waves of roughly equal amplitude.
Impulsive would have a very long "wave 3" and no overlaps.
This could be a "Buy-the-Dip" coin soon, but am not buying here.
Break of resistance and retest with a "Ping" is worth a shot at buying.
Aggressive bears might short upon fall from Grey "decision zone".
The benefits of my Precise Zone maps are:
- Exact entry points and particular behavior becomes emotion-less entry.
- Tight Stop Loss acceptable. If a zone breaks by even a little, it will go to next one.
Previous ETC analysis looking for a bounce (caught a 10% gain):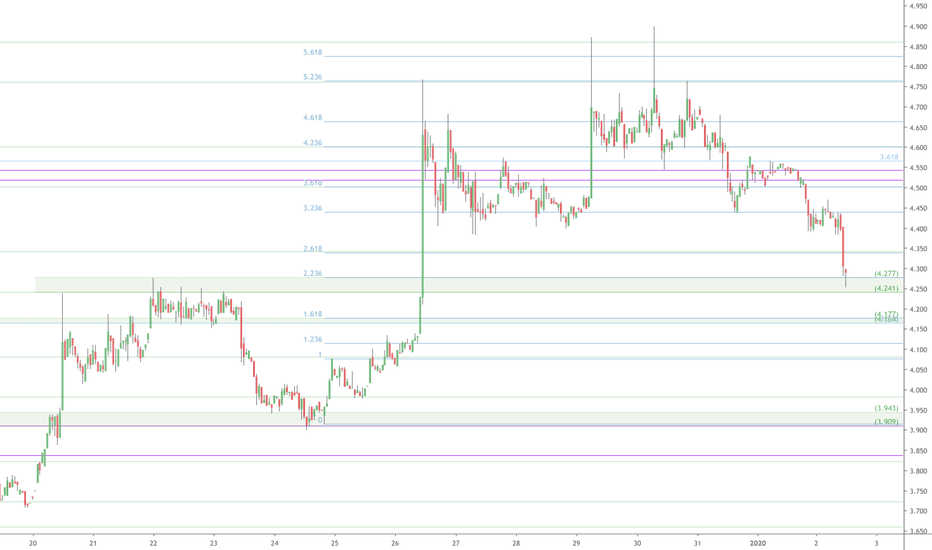
Note
PING Just hit "Major Resistance"
.
Note
CheckPoint 2? "Sir Yes SIR"Nice breakout and run to the next checkpoint, "Major Resistance"
But this does look like it will hit the "VERY Strong Resistance" just above $5 round.
This would be a good place to "Sizzle" against the ceiling for a few hours.
.
Zoom IN (5 min): Hit that zone quite precisely, and ALSO of note is the little pullback and what it Pinged
Here is that fib from above, in its entirety, and the Impulse that birthed it
Based on the ADDED importance of that fib from above, I have adjusted the resistance zone in question
.
IN CONCLUSION:
Will it get there? Dont know, but I can say two things:
- IF we break above this zone, we SHOULD hit the next zone
- IF we hit next zone, I will CLOSE some longs and move trailing Stop below current zone.
=============================================================================
Note
ZONE UPDATEJust noticed another important clue, this Purple Fib with the THICK lines
KEY is the EXTENSION -0.236 (or 1.236 the normal way I do fibs) and the clean PING on it.
.
Based on the Fib and ping of -.236 extension, we can assume the -.382 and -.618 will relevant as well:
If we get to that zone and look to have some fuel left, then we can map a zone around that purple -.618.
But until then, I am assuming $5.044/77 will the top. If not, I will have new clues to project with.
=============================================================================
Note
Approaching the Adjusted Resistance zone from last update just above. So I think we will hit that zone soon.
Reaction there will be very telling.
===================================================================================
Note
Max Target HITHere we are at the top band, the "VERY Strong Resistance" zone
.
Zoom IN (3 min) to see the zone in detail
Price acting like a Comet that just flew past a large Star, and is being captured into orbit.
Lets see where it goes from here, down looks easier than up from here.
=============================================================================
Note
Another Top Nailed.The "VERY Strong" Resistance zone was indeed the top
.
Zoom IN (15 min) for a closer look at that "Very Strong" Resistance zone.
There was some overshoot at first,
then the wave oscillated around the zone.
until it Pinged both boundaries and boom.
Such a pair of rejections from subsequently lower fibs is ALMOST ALWAYS a sign of reversal.
,
Zoom OUT (34 min) to see the entire last wave, and how the pre-mapped zones are PRECISELY relevant
Leading to conclusion that odds are we go lower, but to where?
.
Zoom IN again (5 min) and putting some EW structure on it and fading the red zones for clarity:
Zoom OUT (2 h) to see the entire picture again with that ABC in place:
It will have ended at a perfectly logical place.
.
BUT, it is also possible that we see an ABCDE correction, maybe like this
Return to the "Decsion Zone" to gauge the market sentiment.
I am leaning towards this possibility as being most likely.
It is ALSO possible that we see a much deeper correction something like this:
For that be valid, we should see a new Fib Rhythm developing in the pullback waves.
There is NO mew Fib Rhythm yet (I tried a bunch of placements) AND we are still following the previous Fibs.
So once again I think the previous possibility is more likely that this one.
.
In SUMMARY:
- Topping process was EXACTLY as expected, with two distinct Pings to define both bounds of that resistance zone .
- Pullback thus far looks more like Profit Taking (it is still following the bull Fibs) than Shorting action (no new Fib yet).
- So my current lean is towards another leg down, to our original "Decision Zone", and then see "whats what".
=============================================================================
the Golden Ratio is my Religion
the Trading View is my Nation
the Moderator Tag is my Flag
the Trading View is my Nation
the Moderator Tag is my Flag
Related publications
Disclaimer
The information and publications are not meant to be, and do not constitute, financial, investment, trading, or other types of advice or recommendations supplied or endorsed by TradingView. Read more in the Terms of Use.