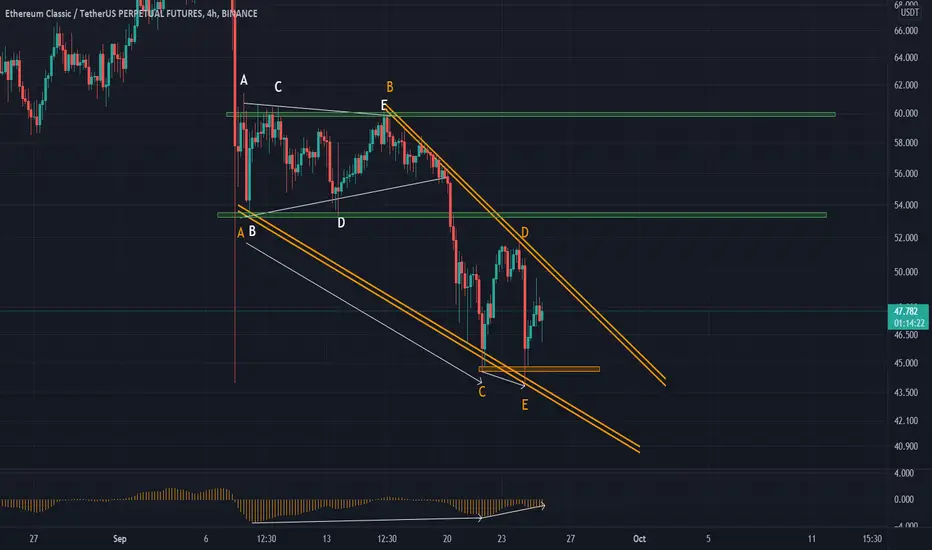
The ETC diagram can see a descending wedge if exiting those green targets , respectively , $ 53 and $ 60 respectively .
a positive divergence is occurring at macd, which can contribute to further development.
a positive divergence is occurring at macd, which can contribute to further development.
Disclaimer
The information and publications are not meant to be, and do not constitute, financial, investment, trading, or other types of advice or recommendations supplied or endorsed by TradingView. Read more in the Terms of Use.
Disclaimer
The information and publications are not meant to be, and do not constitute, financial, investment, trading, or other types of advice or recommendations supplied or endorsed by TradingView. Read more in the Terms of Use.