Weekly Chart
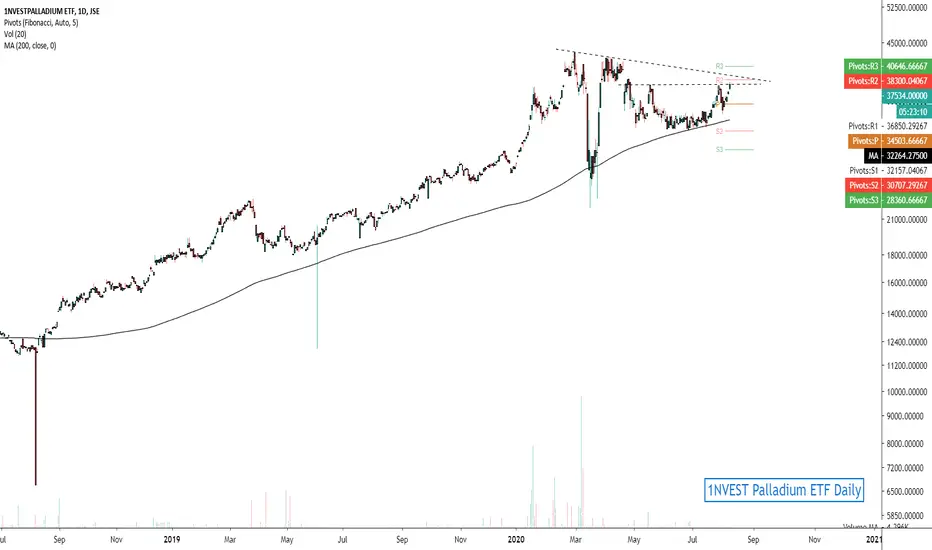
The daily chart of the 1NVEST Palladium ETF is a local vehicle to gain exposure to the potential move, with the price also having consolidated year-to-date. A push above 38900 is a trigger for higher levels and potential continuation of the upward trend.
Time Frame: Medium Term
(See related idea for Rand-Palladium Price)
Related publications
Disclaimer
The information and publications are not meant to be, and do not constitute, financial, investment, trading, or other types of advice or recommendations supplied or endorsed by TradingView. Read more in the Terms of Use.
Related publications
Disclaimer
The information and publications are not meant to be, and do not constitute, financial, investment, trading, or other types of advice or recommendations supplied or endorsed by TradingView. Read more in the Terms of Use.