In my previous analysis, "The Perfect Storm," I laid out a multi-faceted technical case for Ethereum's continued bullish momentum through the end of 2025, targeting the $4,500-$5,200 range. While the price action itself provides a compelling roadmap, a deeper look into Ethereum's market dominance (ETH.D) offers the final, powerful confirmation we've been looking for.
The ETH.D chart, which measures Ethereum's percentage of the total crypto market cap, is often the "tell" that reveals where institutional capital and market momentum are truly flowing. What it's showing now is not just bullish—it's the bedrock upon which the next major leg up will be built.
The Macro Shift: Ethereum is Reclaiming Leadership
Looking at the long-term trend, it's clear that a fundamental shift is underway. After a prolonged period of consolidation, ETH.D has established a clear and sustained uptrend since mid-2024. This pattern of higher lows and higher highs signifies that capital is rotating back into Ethereum, cementing its role as the market's preferred smart contract layer. This isn't just a price rally; it's a fight for market share that Ethereum is winning.
The "May Spring": Dominance Confirms the Wyckoff Accumulation
I previously identified the May 2025 price low as a classic Wyckoff "Spring"—an event designed to flush out weak hands before a major markup. The ETH.D chart provides a stunning confirmation of this thesis.
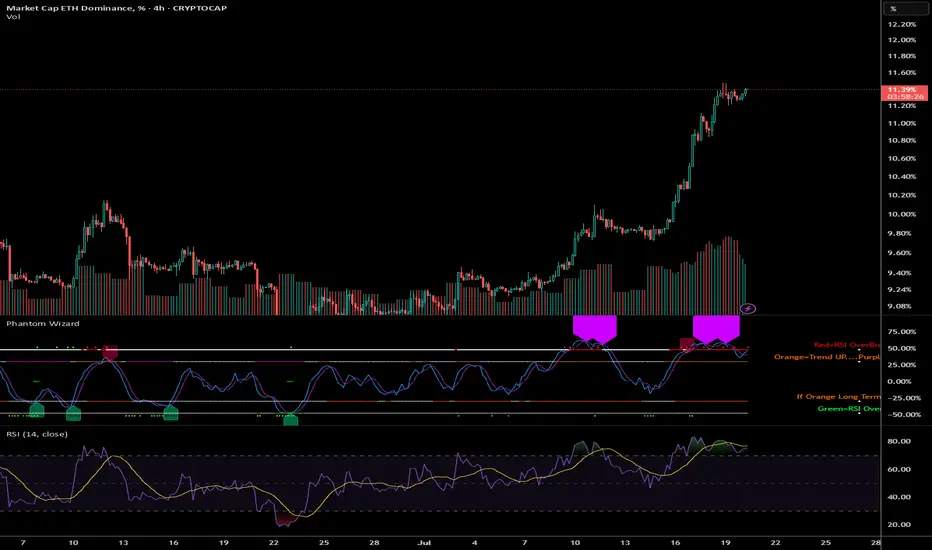
In late May, we saw dominance take a sharp dip to a low of 9.22%, perfectly mirroring the price action. This was the final shakeout. The subsequent powerful rally in dominance through June and into July, reclaiming the 11% level, was a textbook "Sign of Strength" (SOS). This shows that the recovery wasn't just a market-wide bounce; it was driven by a disproportionate flow of capital into Ethereum.
We are now consolidating above this breakout level, forming what appears to be the "Last Point of Support" (LPS) before the next major expansion.
RSI Analysis: The Hidden Fuel in the Tank
While the daily price RSI is showing strong momentum around the 72-73 level, the RSI for ETH.D tells an even more bullish story. Currently hovering in the healthy 50-60 range, the dominance RSI is far from overbought.
This is the perfect "Goldilocks" scenario. It confirms that the trend of Ethereum outperforming the broader market is strong and established, yet it has significant room to run before becoming overheated. This underlying relative strength is the hidden fuel that can and will support the price rally toward our higher targets.
The Confluence That Cannot Be Ignored
What makes this outlook so compelling is the rare confluence of multiple, independent technical frameworks all pointing to the same conclusion.
Price Action: Shows a clear bullish structure.
Wyckoff Methodology: Confirms we are in the final stages of a re-accumulation pattern.
Ethereum Dominance: Provides undeniable evidence of capital rotation and market leadership.
RSI (Price vs. Dominance): Shows a perfect blend of high price momentum and healthy, sustainable relative strength.
When these signals align, the probability of the projected outcome increases exponentially. The technical roadmap is clear: The foundation has been set, the smart money has made its move, and the underlying relative strength is confirming the thesis. Ethereum is poised for a significant appreciation through the remainder of 2025, with the ETH.D trend providing the tailwind needed to reach our targets in the $4,500-$5,200 range.
The ETH.D chart, which measures Ethereum's percentage of the total crypto market cap, is often the "tell" that reveals where institutional capital and market momentum are truly flowing. What it's showing now is not just bullish—it's the bedrock upon which the next major leg up will be built.
The Macro Shift: Ethereum is Reclaiming Leadership
Looking at the long-term trend, it's clear that a fundamental shift is underway. After a prolonged period of consolidation, ETH.D has established a clear and sustained uptrend since mid-2024. This pattern of higher lows and higher highs signifies that capital is rotating back into Ethereum, cementing its role as the market's preferred smart contract layer. This isn't just a price rally; it's a fight for market share that Ethereum is winning.
The "May Spring": Dominance Confirms the Wyckoff Accumulation
I previously identified the May 2025 price low as a classic Wyckoff "Spring"—an event designed to flush out weak hands before a major markup. The ETH.D chart provides a stunning confirmation of this thesis.
In late May, we saw dominance take a sharp dip to a low of 9.22%, perfectly mirroring the price action. This was the final shakeout. The subsequent powerful rally in dominance through June and into July, reclaiming the 11% level, was a textbook "Sign of Strength" (SOS). This shows that the recovery wasn't just a market-wide bounce; it was driven by a disproportionate flow of capital into Ethereum.
We are now consolidating above this breakout level, forming what appears to be the "Last Point of Support" (LPS) before the next major expansion.
RSI Analysis: The Hidden Fuel in the Tank
While the daily price RSI is showing strong momentum around the 72-73 level, the RSI for ETH.D tells an even more bullish story. Currently hovering in the healthy 50-60 range, the dominance RSI is far from overbought.
This is the perfect "Goldilocks" scenario. It confirms that the trend of Ethereum outperforming the broader market is strong and established, yet it has significant room to run before becoming overheated. This underlying relative strength is the hidden fuel that can and will support the price rally toward our higher targets.
The Confluence That Cannot Be Ignored
What makes this outlook so compelling is the rare confluence of multiple, independent technical frameworks all pointing to the same conclusion.
Price Action: Shows a clear bullish structure.
Wyckoff Methodology: Confirms we are in the final stages of a re-accumulation pattern.
Ethereum Dominance: Provides undeniable evidence of capital rotation and market leadership.
RSI (Price vs. Dominance): Shows a perfect blend of high price momentum and healthy, sustainable relative strength.
When these signals align, the probability of the projected outcome increases exponentially. The technical roadmap is clear: The foundation has been set, the smart money has made its move, and the underlying relative strength is confirming the thesis. Ethereum is poised for a significant appreciation through the remainder of 2025, with the ETH.D trend providing the tailwind needed to reach our targets in the $4,500-$5,200 range.
Discord.gg/CryptoIndicators
Disclaimer
The information and publications are not meant to be, and do not constitute, financial, investment, trading, or other types of advice or recommendations supplied or endorsed by TradingView. Read more in the Terms of Use.
Discord.gg/CryptoIndicators
Disclaimer
The information and publications are not meant to be, and do not constitute, financial, investment, trading, or other types of advice or recommendations supplied or endorsed by TradingView. Read more in the Terms of Use.