📉 Overview from Weekly Timeframe:
Price has been clearly rejected from a strong resistance zone aligned with the 50EMA. This rejection signals a potential bearish reversal, especially with recent wick rejections indicating seller strength.
📉 Daily Chart Explanation:
The daily timeframe shows subtle signs of bearish pressure with rejection candles forming, but lacks a clean structure break. Momentum is not yet fully bearish, so traders need to remain cautious and look for lower timeframe confirmation.
📉 4H Chart Explanation:
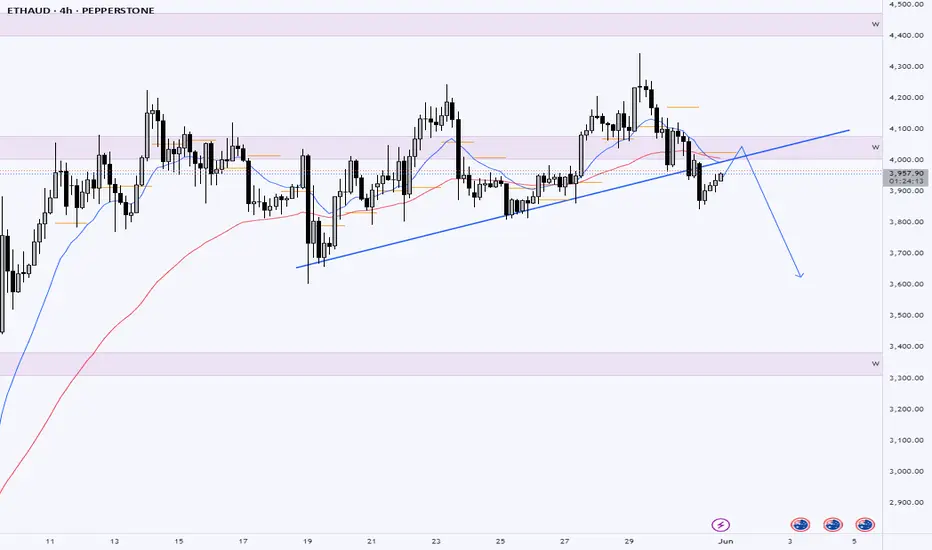
On the 4H chart, ETHAUD has broken below a key trendline and internal structure, confirming a potential shift in trend. Notably, a triple top pattern has formed, suggesting exhaustion from buyers and potential for downside movement. Price is also trading below the 50EMA, reinforcing bearish bias.
📌 Plan:
Bias: Bearish
Entry: On minor pullback below neckline of the triple top or EMA rejection
Targets:
TP1: Recent swing low
TP2: Weekly support zone
Invalidation: A 4H candle close back above the triple top zone and 50EMA
Disclaimer
The information and publications are not meant to be, and do not constitute, financial, investment, trading, or other types of advice or recommendations supplied or endorsed by TradingView. Read more in the Terms of Use.
Disclaimer
The information and publications are not meant to be, and do not constitute, financial, investment, trading, or other types of advice or recommendations supplied or endorsed by TradingView. Read more in the Terms of Use.
