Today’s Technical Analysis – ETHBTC – testing a weekly level with an important candle close
Points to consider,
- Weekly structure
- S/R flip
- Volume below average
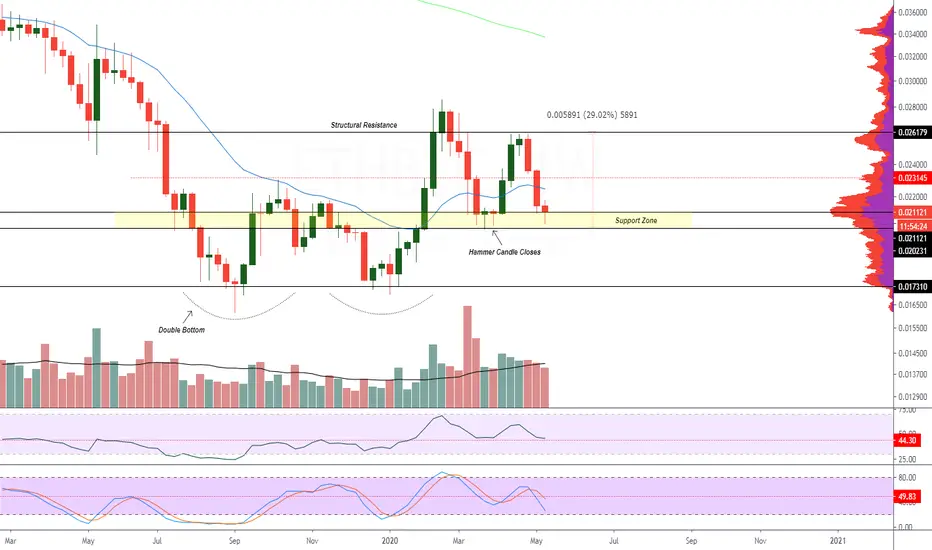
- Structural resistance
ETHBTC is testing an important weekly zone that must remain as support to further solidify the S/R Flip.
A bullish candle close (hammer candle) on a weekly structure will show strength in price action.
It has held previously, leading to an impulse move into structural resistance.
The volume at current given time is trading below average, similar at previous hammer candle closes.
Bull volume needs to increase for follow through, price has been declining for the past 3 weeks, a relief rally will at some point be imminent.
Overall in my opinion, a candle close above the support zone is quite bullish especially on a weekly time frame. If price breaks support zone, this will mean breaking structure, lower levels at previous double bottom will then be targets.
What are your thoughts?
Please leave a like and comment,
And remember,
“The secret to being successful from a trading perspective is to have an indefatigable and an undying and unquenchable thirst for information and knowledge.” - Paul Tudor Jones
Points to consider,
- Weekly structure
- S/R flip
- Volume below average
- Structural resistance
ETHBTC is testing an important weekly zone that must remain as support to further solidify the S/R Flip.
A bullish candle close (hammer candle) on a weekly structure will show strength in price action.
It has held previously, leading to an impulse move into structural resistance.
The volume at current given time is trading below average, similar at previous hammer candle closes.
Bull volume needs to increase for follow through, price has been declining for the past 3 weeks, a relief rally will at some point be imminent.
Overall in my opinion, a candle close above the support zone is quite bullish especially on a weekly time frame. If price breaks support zone, this will mean breaking structure, lower levels at previous double bottom will then be targets.
What are your thoughts?
Please leave a like and comment,
And remember,
“The secret to being successful from a trading perspective is to have an indefatigable and an undying and unquenchable thirst for information and knowledge.” - Paul Tudor Jones
Join the Free Trading Group
Telegram: t.me/freetradingden 🔥
Unlock Blofin Bonuses
Trade with perks & support the community!
blofin.com/invite/alchemisttrader 🎁
Stay sharp, trade smart.
— Team The Alchemist ⚔️
Telegram: t.me/freetradingden 🔥
Unlock Blofin Bonuses
Trade with perks & support the community!
blofin.com/invite/alchemisttrader 🎁
Stay sharp, trade smart.
— Team The Alchemist ⚔️
Disclaimer
The information and publications are not meant to be, and do not constitute, financial, investment, trading, or other types of advice or recommendations supplied or endorsed by TradingView. Read more in the Terms of Use.