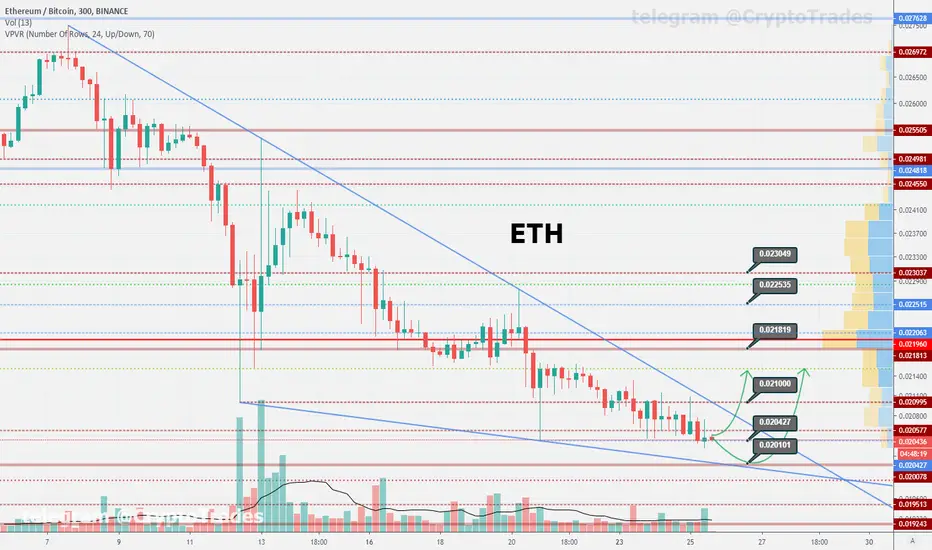
Huge falling wedge at Ethereum chart. That could be a signal for bounce and short term bullish move.
Resistance 21000 - 21500 - 21800
Support 20400 - 20000

Last time I caught the top. Maybe this time we catch bottom together ;)
Resistance 21000 - 21500 - 21800
Support 20400 - 20000
Last time I caught the top. Maybe this time we catch bottom together ;)
Note
Ethereum dumped back to 20400 support, and now making a bounce. Most probably will be rejected at 20700 resistance. If not and close above, will be a bullish sign. Otherwise drop down to lower support zones seem realistic, as this chart is still within the downtrend.
Resistance 20700 - 21100 - 21400 - 21800
Support 20400 - 20100 - 19200
FREE telegram channels:
Crypto reviews - t.me/WiseAnalyze
Crypto chat - t.me/WiseAnalyzeChat
Crypto watchlist - t.me/WiseAnalyzeDCA
Forex/Stocks - t.me/WiseForex
Crypto reviews - t.me/WiseAnalyze
Crypto chat - t.me/WiseAnalyzeChat
Crypto watchlist - t.me/WiseAnalyzeDCA
Forex/Stocks - t.me/WiseForex
Related publications
Disclaimer
The information and publications are not meant to be, and do not constitute, financial, investment, trading, or other types of advice or recommendations supplied or endorsed by TradingView. Read more in the Terms of Use.