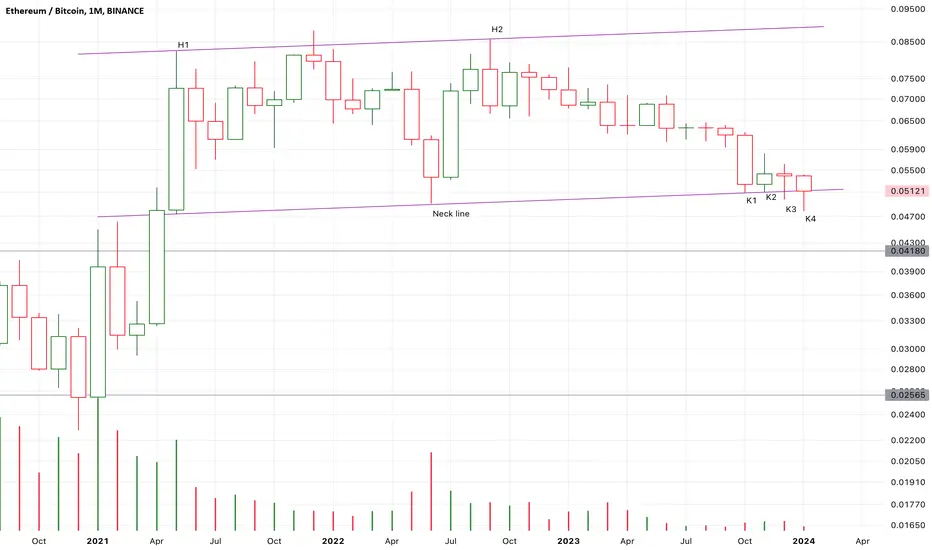
K4 is breaking down the neck line of a potential double top bearish pattern.
The possibility of breaking down is relatively high here.
From K2 to K3, the supply pressure increased.
It is likely that K4 will accelerate to breaking down.
It means that it is not worth to hold more ETH than BTC temporarily.
If K4 failed to close below K3, and even break up K3,
I will try to hold more ETH than BTC.
Trade closed: stop reached
K4 is breaking up K3,
So, the previous supposed double top bearish pattern will likely died here.
I am considering to exchange BTC to more ETH.
Note
The recent 8 candles is a potential uptrend triangle or flag pattern.
However,K2 failed to break up the downtrend line.
So, the risk increase here.
If K3 close upon K2, ETH will keep the strong momentum than BTC.
If K2 close below K1, the bear market of ETH/BTC will restore its strength.
Note
K2 to K4 is a bearish three soldiers advancing pattern,
It break down the supposed flag pattern.
It turned the previous strong uptrend momentum to be more neutral.
The risk is increasing here.
K4 is also a spring candle on the support.
The bearish momentum temporarily stopped here.
K5 will likely up to test the high price area of K4.
If K5 or K6 couldn’t close upon K4,
The support will lost its support here.
Disclaimer
The information and publications are not meant to be, and do not constitute, financial, investment, trading, or other types of advice or recommendations supplied or endorsed by TradingView. Read more in the Terms of Use.
Disclaimer
The information and publications are not meant to be, and do not constitute, financial, investment, trading, or other types of advice or recommendations supplied or endorsed by TradingView. Read more in the Terms of Use.