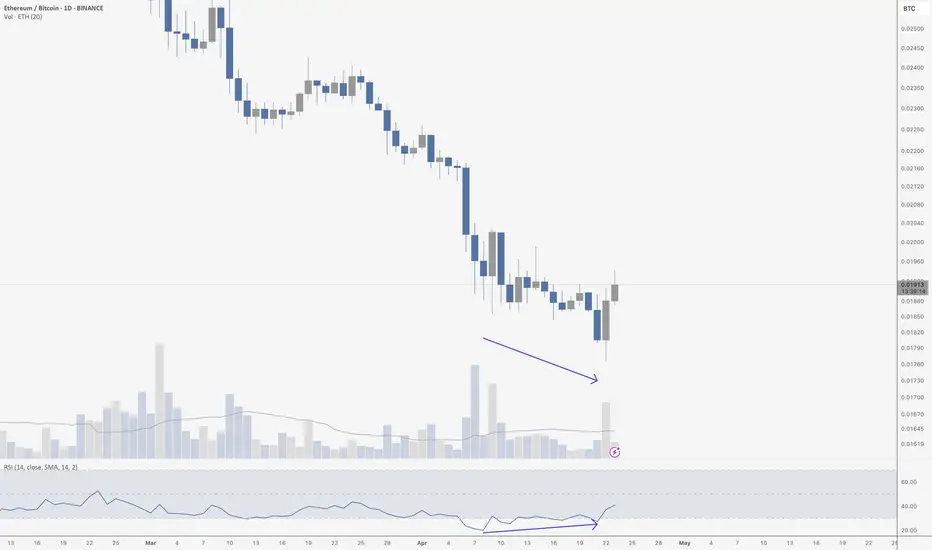
ETH/BTC continues to be the punching bag of crypto – but the chart is finally showing signs of life.
We’ve got clear bullish divergence on the daily RSI. While price made a lower low, RSI made a higher low – hinting at momentum shifting beneath the surface. Volume also ticked up as ETH pushed higher, adding a bit of confirmation.
Zoom out, and it’s even more compelling: ETH is historically oversold on the weekly chart (not shown here). This signal has triggered some major reversals in the past. Yes, it’s failed before – especially on ETH – but this setup is one of the more reliable ones across markets.
I know I’m a glutton for punishment posting ETH charts while it’s still limping around the floor, but that’s usually where opportunity likes to hide. We found the bottom in the newsletter 9 days ago. Now we need follow through.
info@thewolfoallstreets.io
Disclaimer
The information and publications are not meant to be, and do not constitute, financial, investment, trading, or other types of advice or recommendations supplied or endorsed by TradingView. Read more in the Terms of Use.
info@thewolfoallstreets.io
Disclaimer
The information and publications are not meant to be, and do not constitute, financial, investment, trading, or other types of advice or recommendations supplied or endorsed by TradingView. Read more in the Terms of Use.