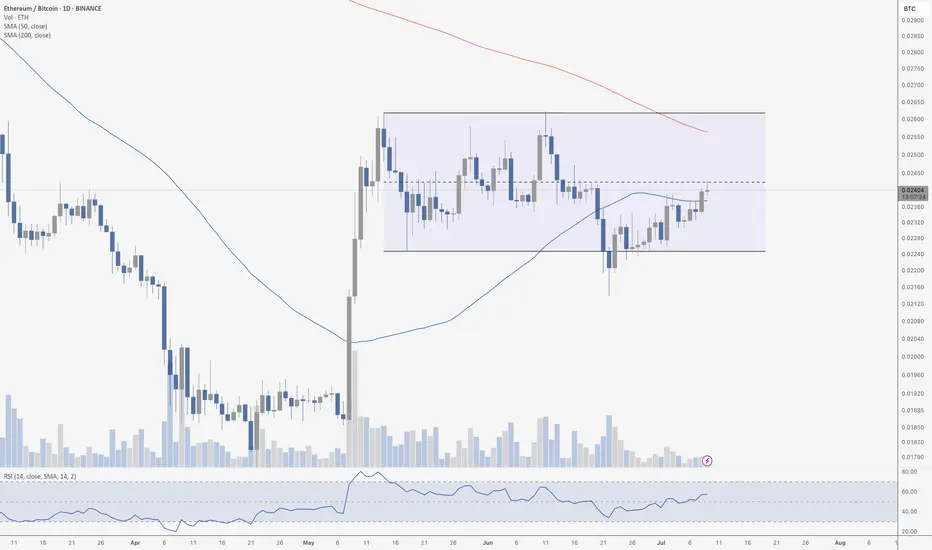
The ETH/BTC daily chart shows a prolonged consolidation phase following the explosive breakout in early May. Since then, price has been range-bound between approximately 0.022 and 0.026. We're currently sitting near the EQ (equilibrium) of the range – around 0.0240 – which often acts as a temporary magnet for price and a decision point for direction.
Importantly, ETH/BTC closed back above the 50-day moving average yesterday for the first time in weeks. This is a notable shift in short-term momentum and could be an early sign of bullish continuation, especially if the pair can push above the EQ and flip it into support. RSI is trending upward without being overbought, adding to the momentum argument.
However, until we get a breakout from this range – particularly a close above the 0.026 resistance – it’s still a game of chop. The return above the 50 MA is promising, but bulls need to defend it and push higher to regain control.
scott.melker@texaswestcapital.com
Disclaimer
The information and publications are not meant to be, and do not constitute, financial, investment, trading, or other types of advice or recommendations supplied or endorsed by TradingView. Read more in the Terms of Use.
scott.melker@texaswestcapital.com
Disclaimer
The information and publications are not meant to be, and do not constitute, financial, investment, trading, or other types of advice or recommendations supplied or endorsed by TradingView. Read more in the Terms of Use.