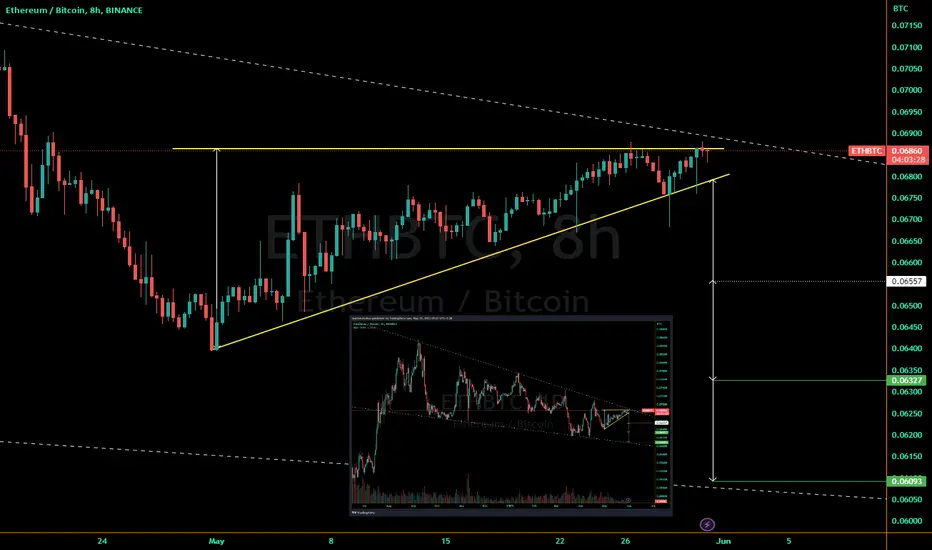
The 8 hour chart shows a rising wedge. Its 1.5x target lies near the bottom of a larger falling wedge as seen on the daily or weekly charts.
Short until reaching the bottom of the wedge, then long.
Short until reaching the bottom of the wedge, then long.
Trade closed: target reached
First target reached after a failed breakout of both the rising wedge and the larger falling wedgeI still think we're headed all the way to wedge bottom, and possibly lower
Disclaimer
The information and publications are not meant to be, and do not constitute, financial, investment, trading, or other types of advice or recommendations supplied or endorsed by TradingView. Read more in the Terms of Use.
Disclaimer
The information and publications are not meant to be, and do not constitute, financial, investment, trading, or other types of advice or recommendations supplied or endorsed by TradingView. Read more in the Terms of Use.