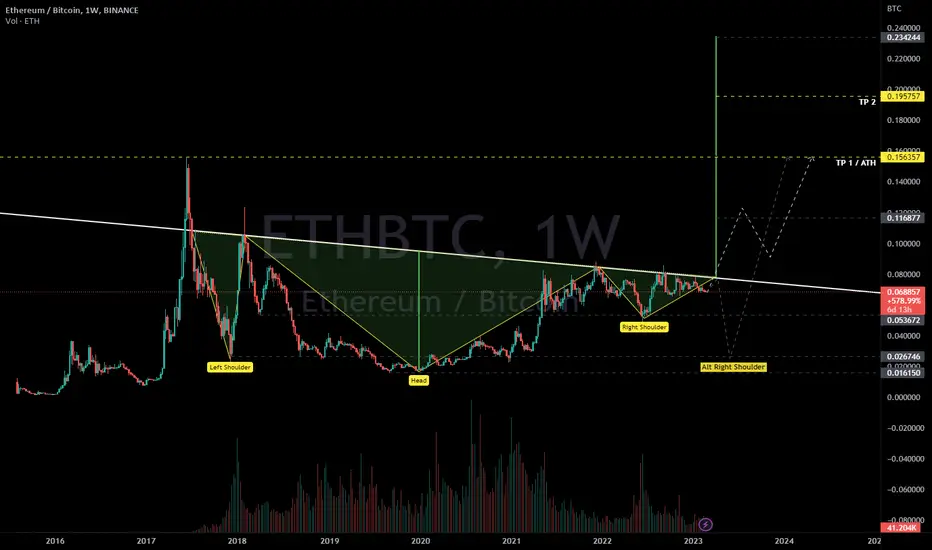
Possible inverted HS forming on the weekly Ethereum / BTC chart. Question is - are we forming the right shoulder now, or will we see a strong dip forming a more symmetrical right shoulder first?
Chart is marked Long, but could be a strong short down towards 0.02 btc prior to turning long. Need to see weekly break and hold above the neckline before actually positioning a long.
Chart is marked Long, but could be a strong short down towards 0.02 btc prior to turning long. Need to see weekly break and hold above the neckline before actually positioning a long.
Note
Update, there could be a major buying opportunity should Ethereum give us the proposed alternate right shoulder here. Imagine something like this could occur if Bitcoin has a parabolic move up soon:Note
Update to the above, again should Bitcoin have a very strong move, Ethereum could drop to either of these two levels in the 0.045ish range or even the 0.026ish area:Disclaimer
The information and publications are not meant to be, and do not constitute, financial, investment, trading, or other types of advice or recommendations supplied or endorsed by TradingView. Read more in the Terms of Use.
Disclaimer
The information and publications are not meant to be, and do not constitute, financial, investment, trading, or other types of advice or recommendations supplied or endorsed by TradingView. Read more in the Terms of Use.