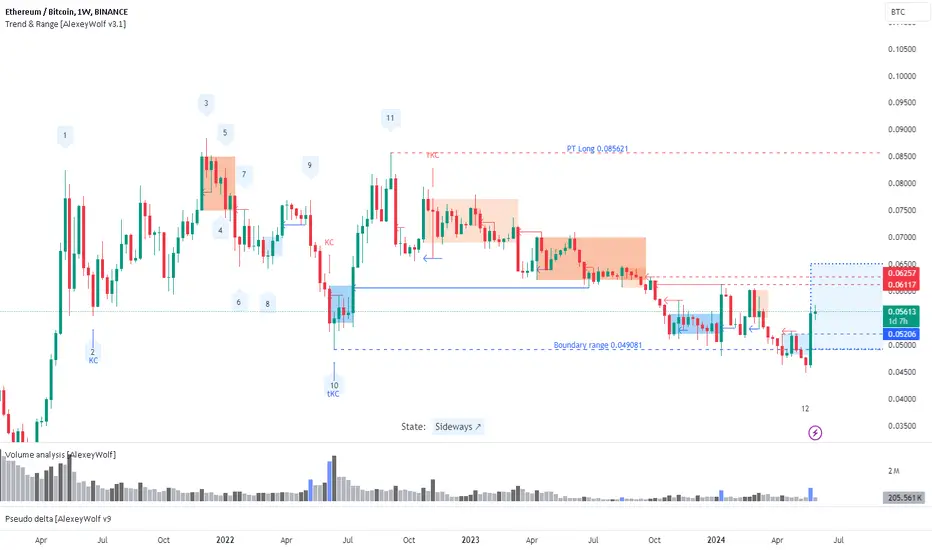
On the weekly time frame (TF), there has been a sideways movement since May 2021. The seller's vector 11-12 interacted with the lower boundary of the range at 0.049081 several times. After the first interaction in January 2024, the buyer performed well with a single weekly candle (January 8th), forming a buyer's zone (blue rectangle on the chart). A similar situation is happening now, with the weekly candle on May 20th also showing a good spread and volume, creating another buyer's zone (blue rectangle on the chart, with the upper boundary at 0.05206). Since the seller's vector has reached all its targets within the range, the current buyer's vector is 12-13. The potential target is 0.085621 (~50%), and it seems reasonable to look for buying opportunities. However, the question remains whether the buyer's activity will develop further or if the price will update the local minimum again (0.04473).
It is reasonable to look for buying opportunities on the weekly time frame from the buyer's zone (upper edge – 0.05206), with the idea of realizing the buyer's vector 12-13. The first potential targets are 0.06117 and 0.06257, with an ambitious target of 0.085621.
Let's examine the lower time frames to determine where else it is reasonable to look for buying opportunities.
Daily Time Frame

On the daily time frame, there was a seller's trend. The last seller's impulse started from the level 0.05249 and ended at the level 0.04473. Then, there was a buyer's impulse, and now the price is above 0.05249, indicating that the seller's trend has stopped. The key candle of the buyer's impulse (the highest volume in the impulse, marked as "KC" on the chart) is at the end of the impulse.
Buying opportunities can be considered if the buyer defends the levels at 0.05332 (the key candle of the impulse) and 0.05249 (the price of the last seller's impulse started from), with the idea of initiating a long trend and breaking above 0.05744. It would be cool, during the seller's attack on the level 0.05249, the price moves into the buyer's zone on the weekly TF (0.05206 or below), and then the buyer brings the price back above 0.05249 and defends this level.
If the price falls below 0.05249 and the seller defends this level, it is likely that the price will move towards the local minimum (0.04473).
4-Hour Time Frame

The price has formed a sideways movement. The buyer's vector 6-7 has reached its targets. The current seller's vector 7-8 has a potential target of 0.05322 (see the 0.05322 level on the daily TF above). The lower boundary of the range is 0.0525, which coincides with the 0.05249 level on the daily TF.
It makes sense to look for buying opportunities on the 4-hour TF if the buyer defends the levels at 0.05322 or 0.0525, based on the idea of the buyer's vector 8-9 within the range.
Sales can also be considered from the seller's defense of the 0.05622 or 0.05744 levels, based on the idea of the realization of the 7-8 vector within the range.
It is reasonable to look for buying opportunities on the weekly time frame from the buyer's zone (upper edge – 0.05206), with the idea of realizing the buyer's vector 12-13. The first potential targets are 0.06117 and 0.06257, with an ambitious target of 0.085621.
Let's examine the lower time frames to determine where else it is reasonable to look for buying opportunities.
Daily Time Frame
On the daily time frame, there was a seller's trend. The last seller's impulse started from the level 0.05249 and ended at the level 0.04473. Then, there was a buyer's impulse, and now the price is above 0.05249, indicating that the seller's trend has stopped. The key candle of the buyer's impulse (the highest volume in the impulse, marked as "KC" on the chart) is at the end of the impulse.
Buying opportunities can be considered if the buyer defends the levels at 0.05332 (the key candle of the impulse) and 0.05249 (the price of the last seller's impulse started from), with the idea of initiating a long trend and breaking above 0.05744. It would be cool, during the seller's attack on the level 0.05249, the price moves into the buyer's zone on the weekly TF (0.05206 or below), and then the buyer brings the price back above 0.05249 and defends this level.
If the price falls below 0.05249 and the seller defends this level, it is likely that the price will move towards the local minimum (0.04473).
4-Hour Time Frame
The price has formed a sideways movement. The buyer's vector 6-7 has reached its targets. The current seller's vector 7-8 has a potential target of 0.05322 (see the 0.05322 level on the daily TF above). The lower boundary of the range is 0.0525, which coincides with the 0.05249 level on the daily TF.
It makes sense to look for buying opportunities on the 4-hour TF if the buyer defends the levels at 0.05322 or 0.0525, based on the idea of the buyer's vector 8-9 within the range.
Sales can also be considered from the seller's defense of the 0.05622 or 0.05744 levels, based on the idea of the realization of the 7-8 vector within the range.
Note
The seller defended the 0.05622 level and reached the short vector 7-8 target (0.05332) in the 4-hour TF sideways trend. We see the buyer's reaction from the 0.05332 level, and a buyer's zone has formed at the base of the buyer's candle. We can start looking for purchases from the idea of implementing the buyer's vector 8-9 with a potential target of 0.05659. The most interesting option for looking for purchases was described in the previous post. However, for its implementation, the seller needs to push the price even lower. Observing.
Note
On the daily timeframe, the price has fallen back below the level of 0.05249. If the seller defends this level, the price is likely to move towards the local minimum (see the first post). The buyer has not yet shown any significant activity.On the 20-minute timeframe, a range has formed below the daily level of 0.05249.
Look for selling opportunities if the seller defends the upper boundary of the range or wait for the price to break out of the range downwards and then look for selling opportunities if the seller defends this breakout.
Consider buying opportunities if the price breaks out of the range upwards and the buyer defends this breakout.
Wishing you profitable trades!
Clarity on the Chart. Smart Trading Decisions.
No signals. Just clean structure and context t.me/user_friendly_trading
Clarity on the Chart. Smart Trading Decisions.
No signals. Just clean structure and context t.me/user_friendly_trading
Disclaimer
The information and publications are not meant to be, and do not constitute, financial, investment, trading, or other types of advice or recommendations supplied or endorsed by TradingView. Read more in the Terms of Use.