A confluence of technical signals on the weekly ETH/BTC chart, coupled with significant fundamental developments for both Ethereum and Bitcoin, suggests a potential upward move for the pairing in the coming weeks.
Technical Analysis (TA)
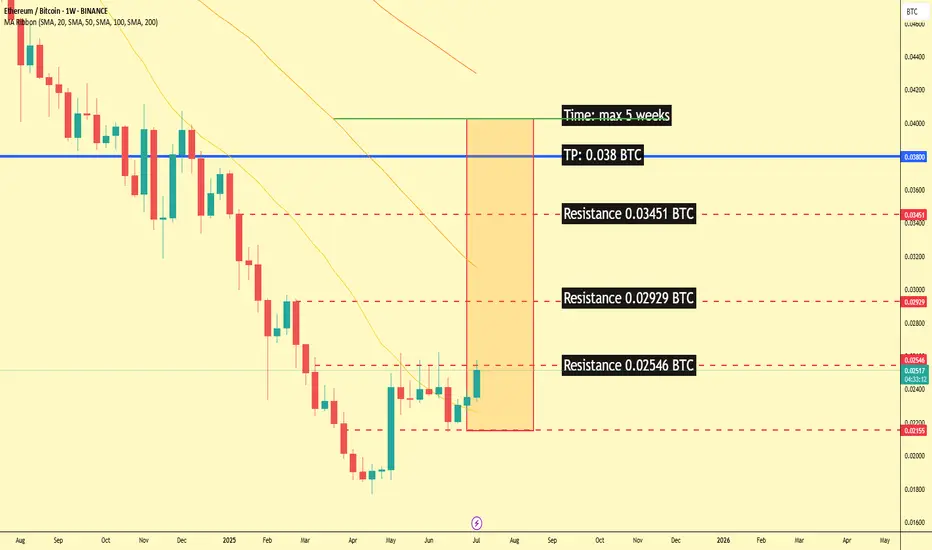
The weekly chart for ETH/BTC on Binance reveals a potential bottoming formation after a prolonged downtrend. The price has been consolidating in recent months, and the latest weekly candle shows a strong bullish engulfing pattern, indicating a possible shift in momentum.
Key levels to watch, as identified on the chart, are:
Immediate Resistance: 0.02546 BTC. A decisive close above this level on the weekly timeframe would be the first confirmation of a potential trend reversal.
Further Resistance: 0.02929 BTC and 0.03451 BTC. These represent subsequent hurdles for the bulls to overcome.
Take Profit Target: 0.038 BTC. This level is marked as the ultimate target for this potential upward move.
Timeframe: The analysis on the chart suggests a maximum timeframe of 5 weeks for this trade idea to play out.
Moving Averages: The price is currently trading below the MA Ribbon (SMA, 20, 50, 100, 200), which could act as dynamic resistance. A break above this ribbon would further strengthen the bullish case.
Fundamental Analysis (FA)
The current market environment in July 2025 provides several fundamental catalysts that could impact the ETH/BTC ratio.
For Ethereum (ETH):
Growing Institutional Interest: Ethereum ETFs have seen significant inflows, with over $890 million in July 2025 alone, driven by increasing confidence from institutional investors.[1] Asset managers like BlackRock are accumulating substantial amounts of ETH, reducing the available supply on the market.
Network Upgrades: The upcoming "Pectra" upgrade, which includes Proto-Danksharding (EIP-4844), is anticipated in Q3 or early Q4 2025. This is expected to significantly reduce Layer-2 transaction costs and improve scalability, further enhancing the utility of the Ethereum network. The earlier Pectra upgrade in 2025 already introduced user-friendly features like smart accounts.
Ecosystem Growth: The Linea project, a prominent player in Ethereum's DeFi ecosystem, has a Token Generation Event (TGE) scheduled for July 2025, which is expected to drive market shifts. The overall DeFi ecosystem on Ethereum is showing signs of revitalization.
For Bitcoin (BTC):
Strong Institutional Demand: Similar to Ethereum, Bitcoin is experiencing a wave of institutional adoption, with significant inflows into spot Bitcoin ETFs. Public companies are now holding BTC in their treasuries, and major financial institutions view it as a strategic asset.
New All-Time Highs: Bitcoin has recently surged to new all-time highs, breaking key trendlines and signaling a new bullish era. This strong performance often has a spillover effect on the broader crypto market, including altcoins like Ethereum.
Favorable Macro Environment: Some analysts point to a looser monetary policy from global central banks and inflation concerns as factors boosting demand for hard assets like Bitcoin.
ETH vs. BTC Dynamics:
While Bitcoin's price has seen impressive gains, some analysts believe Ethereum has room to catch up.[8] The ETH/BTC ratio is a key metric for gauging the relative strength of the two leading cryptocurrencies. An upward trend in the ETH/BTC chart, as suggested by the technical analysis, would indicate that Ethereum is outperforming Bitcoin. The performance of ETH relative to Bitcoin is often seen as a barometer for the broader altcoin market.
My point of view
The technical setup on the ETH/BTC weekly chart presents a compelling case for a potential bullish reversal in the short to medium term. This is supported by strong fundamental developments within the Ethereum ecosystem, including significant institutional inflows and major network upgrades. While Bitcoin's own bullish momentum is a factor to consider, the potential for Ethereum to outperform in the coming weeks, as indicated by the provided chart analysis, offers an interesting trading opportunity. Traders should closely monitor the identified resistance levels for confirmation of a breakout.
Technical Analysis (TA)
The weekly chart for ETH/BTC on Binance reveals a potential bottoming formation after a prolonged downtrend. The price has been consolidating in recent months, and the latest weekly candle shows a strong bullish engulfing pattern, indicating a possible shift in momentum.
Key levels to watch, as identified on the chart, are:
Immediate Resistance: 0.02546 BTC. A decisive close above this level on the weekly timeframe would be the first confirmation of a potential trend reversal.
Further Resistance: 0.02929 BTC and 0.03451 BTC. These represent subsequent hurdles for the bulls to overcome.
Take Profit Target: 0.038 BTC. This level is marked as the ultimate target for this potential upward move.
Timeframe: The analysis on the chart suggests a maximum timeframe of 5 weeks for this trade idea to play out.
Moving Averages: The price is currently trading below the MA Ribbon (SMA, 20, 50, 100, 200), which could act as dynamic resistance. A break above this ribbon would further strengthen the bullish case.
Fundamental Analysis (FA)
The current market environment in July 2025 provides several fundamental catalysts that could impact the ETH/BTC ratio.
For Ethereum (ETH):
Growing Institutional Interest: Ethereum ETFs have seen significant inflows, with over $890 million in July 2025 alone, driven by increasing confidence from institutional investors.[1] Asset managers like BlackRock are accumulating substantial amounts of ETH, reducing the available supply on the market.
Network Upgrades: The upcoming "Pectra" upgrade, which includes Proto-Danksharding (EIP-4844), is anticipated in Q3 or early Q4 2025. This is expected to significantly reduce Layer-2 transaction costs and improve scalability, further enhancing the utility of the Ethereum network. The earlier Pectra upgrade in 2025 already introduced user-friendly features like smart accounts.
Ecosystem Growth: The Linea project, a prominent player in Ethereum's DeFi ecosystem, has a Token Generation Event (TGE) scheduled for July 2025, which is expected to drive market shifts. The overall DeFi ecosystem on Ethereum is showing signs of revitalization.
For Bitcoin (BTC):
Strong Institutional Demand: Similar to Ethereum, Bitcoin is experiencing a wave of institutional adoption, with significant inflows into spot Bitcoin ETFs. Public companies are now holding BTC in their treasuries, and major financial institutions view it as a strategic asset.
New All-Time Highs: Bitcoin has recently surged to new all-time highs, breaking key trendlines and signaling a new bullish era. This strong performance often has a spillover effect on the broader crypto market, including altcoins like Ethereum.
Favorable Macro Environment: Some analysts point to a looser monetary policy from global central banks and inflation concerns as factors boosting demand for hard assets like Bitcoin.
ETH vs. BTC Dynamics:
While Bitcoin's price has seen impressive gains, some analysts believe Ethereum has room to catch up.[8] The ETH/BTC ratio is a key metric for gauging the relative strength of the two leading cryptocurrencies. An upward trend in the ETH/BTC chart, as suggested by the technical analysis, would indicate that Ethereum is outperforming Bitcoin. The performance of ETH relative to Bitcoin is often seen as a barometer for the broader altcoin market.
My point of view
The technical setup on the ETH/BTC weekly chart presents a compelling case for a potential bullish reversal in the short to medium term. This is supported by strong fundamental developments within the Ethereum ecosystem, including significant institutional inflows and major network upgrades. While Bitcoin's own bullish momentum is a factor to consider, the potential for Ethereum to outperform in the coming weeks, as indicated by the provided chart analysis, offers an interesting trading opportunity. Traders should closely monitor the identified resistance levels for confirmation of a breakout.
Trade active
Traders should proceed with caution. As we have learned the hard way in the past, a sudden flash crash before a significant pump is not an exception in the crypto markets. It is crucial to be prepared for volatility. The identified resistance levels could be "wicked" – meaning the price might momentarily spike above these levels to trigger stop-losses before reversing. Therefore, it is essential to manage your risk and set your leverage at a safe and appropriate level.Disclaimer
The information and publications are not meant to be, and do not constitute, financial, investment, trading, or other types of advice or recommendations supplied or endorsed by TradingView. Read more in the Terms of Use.
Disclaimer
The information and publications are not meant to be, and do not constitute, financial, investment, trading, or other types of advice or recommendations supplied or endorsed by TradingView. Read more in the Terms of Use.