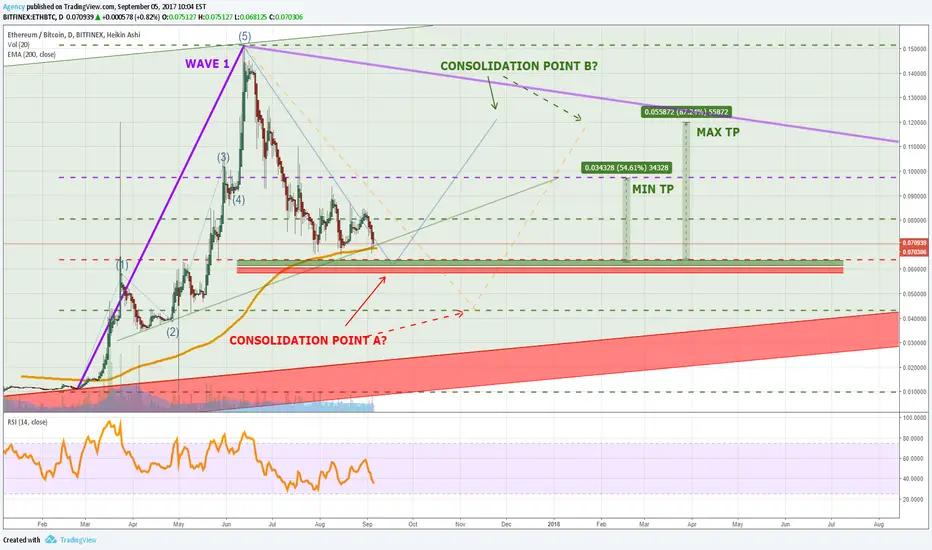
The data suggests we should be looking for the end of consolidation wave A. Ideally we would touch or go below the 0.382, and then cross the descending trend line as a structural confirmation. The ETHUSD chart is loaded with "USD chart bias," so any long term positioning in this asset should be based on this BTC chart. Even once we find the bottom of wave A, we will likely only enter a short term position until the sell-off with the completion of consolidation wave B. Long term portfolio building will likely only take place at the completion of correction wave C. Because we have no clear pattern at this time, we may also be facing a Bitcoin Cash-style correction with the descending wedge. If this is the case, we are likely to consolidated past the 0.236; this is a long way down. The only reason this asset still holds a dollar value is a result of performance in the BTCUSD pair. Good luck Ethereum holders.
Note
Note
We are now kissing the recent bullish trend line. :ONote
Hmmmm...Note
I've never posted my ETHUSD chart, but I can imagine there is some panic for some of you. Here you go: I can't see it trading below $195 today.Note
Still testing the key fibo. If this lets go, it will look very bearish in the ETHUSD chart.Meanwhile, the ETHUSD chart already looks bearish enough as it punched through the key fibo level.
Note
Its still bearish in this ETHBTC chart. If you are trading in the ETHUSD pair, all you have is BTCUSD strength.Note
ATTENTION ETH HODLERS! Breaching the critical key fibo level :(Note
next support at 0.043Note
There is still some room left in the channel rally here, which could give strength to ETHUSD traders.. RSI is pointing upNote
My ETHUSD and ETHBTC chart:If we bounce from the trendline its a good buy opportunity.
If we break out of the key fibo box we head toward the uptrend line.
Note
Classic support ahead, which is at the hourly fibo extension. Breaking through this would be rough.Note
Note
Heading toward consolidation point A from our original chart. It will be interesting to see what happens when we get there.Note
We are now testing consolidation point A, again... time to watch carefully.Disclaimer
The information and publications are not meant to be, and do not constitute, financial, investment, trading, or other types of advice or recommendations supplied or endorsed by TradingView. Read more in the Terms of Use.
Disclaimer
The information and publications are not meant to be, and do not constitute, financial, investment, trading, or other types of advice or recommendations supplied or endorsed by TradingView. Read more in the Terms of Use.