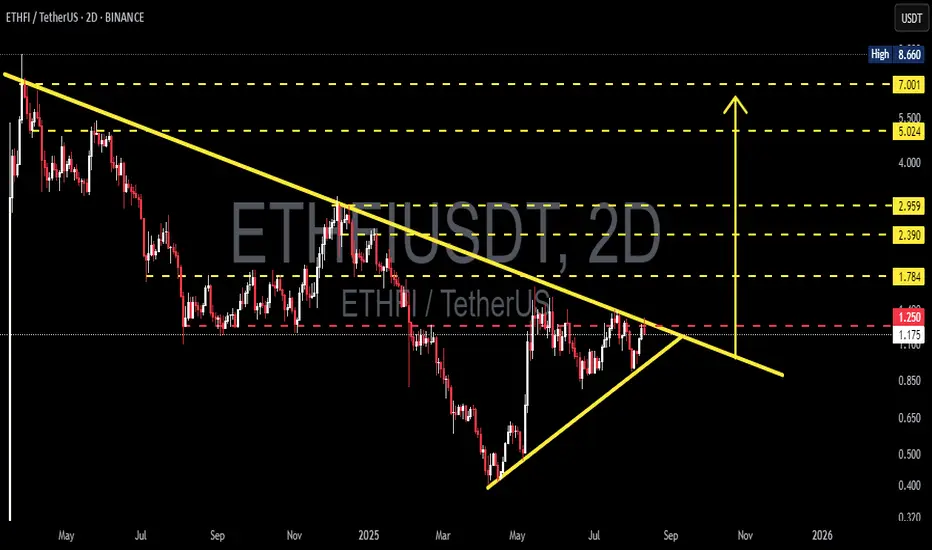
The chart shows a symmetric triangle pattern (descending resistance + ascending support) approaching its apex. Price is currently testing the descending resistance area around 1.25 (red label) — a major decision point. Key horizontal targets/support levels are already marked on the chart (yellow).
---
Pattern Description
* Pair: ETHFI / USDT, 2-Day timeframe.
* Previous long-term trend: bearish (descending resistance line from the left).
* After bottoming near \~0.32–0.40, price formed higher lows (rising support) and lower highs (falling resistance) → creating a symmetric triangle / wedge.
* Volume typically contracts as the pattern nears the apex — this is a neutral-to-continuation pattern: often continues in the prior trend (bearish) but can also break upward strongly if there’s a catalyst.
---
Key Levels
Resistance / Upside targets:
* 1.250 — near-term resistance (↑ +6.4%).
* 1.784 — next major (↑ +51.8%).
* 2.390 (↑ +103.4%).
* 2.959 (↑ +151.8%).
* 5.024 (↑ +327.6%).
* 7.001 (↑ +495.8%).
* 8.660 (High, ↑ +637.0%).
Support / Downside levels:
* 0.850 (↓ −27.7%).
* 0.650 (↓ −44.7%).
* 0.500 (↓ −57.4%).
* 0.400 (↓ −66.0%).
* 0.320 (↓ −72.8%).
---
BULLISH Scenario (if breakout occurs):
* Breakout confirmation: 2D candle close above the descending resistance line + above 1.250, with increased volume. Ideally, a retest as support after the breakout.
* First target: 1.784 (conservative TP). If momentum is strong: 2.39 → 2.959.
* Risk management: stop loss below breakout candle or below the rising support line (e.g., entry at 1.30, stop \~1.00–1.05). Use position sizing to keep per-trade risk small (1–3% of capital).
* Significance: a break above will signal a potential *trend reversal* from long-term downtrend to accumulation/uptrend.
BEARISH Scenario (if breakdown occurs):
* Breakdown confirmation: 2D candle close below the rising support line with increased sell volume; failed retest confirms weakness.
* First target: 0.850. If selling pressure continues: 0.65 → 0.50 → 0.32.
* Risk management: if shorting, stop above retest/resistance (or above 1.25 if a failed breakout).
* Significance: since the prior long-term trend is bearish, a breakdown has high probability of trend continuation to the downside.
---
Trade Ideas
* Conservative: set alerts for 2D close > 1.25 + higher volume; partial entry, partial TP at 1.78, trail the rest.
* Aggressive: enter on breakout & retest of resistance as support.
* Bear setup: short after confirmed close below rising support & failed retest; target 0.85 first.
---
Technical & Psychological Notes:
* Pattern is very close to the apex → large move likely within the next few weeks on the 2D chart.
* Volume & candle close are key to avoid chasing fake breakouts.
* Also watch general crypto sentiment & news catalysts as they can trigger breakouts against the technical bias.
#ETHFI #Crypto #TechnicalAnalysis #Triangle #Breakout #SupportResistance #Altcoins #CryptoTrading #BullBear
---
Pattern Description
* Pair: ETHFI / USDT, 2-Day timeframe.
* Previous long-term trend: bearish (descending resistance line from the left).
* After bottoming near \~0.32–0.40, price formed higher lows (rising support) and lower highs (falling resistance) → creating a symmetric triangle / wedge.
* Volume typically contracts as the pattern nears the apex — this is a neutral-to-continuation pattern: often continues in the prior trend (bearish) but can also break upward strongly if there’s a catalyst.
---
Key Levels
Resistance / Upside targets:
* 1.250 — near-term resistance (↑ +6.4%).
* 1.784 — next major (↑ +51.8%).
* 2.390 (↑ +103.4%).
* 2.959 (↑ +151.8%).
* 5.024 (↑ +327.6%).
* 7.001 (↑ +495.8%).
* 8.660 (High, ↑ +637.0%).
Support / Downside levels:
* 0.850 (↓ −27.7%).
* 0.650 (↓ −44.7%).
* 0.500 (↓ −57.4%).
* 0.400 (↓ −66.0%).
* 0.320 (↓ −72.8%).
---
BULLISH Scenario (if breakout occurs):
* Breakout confirmation: 2D candle close above the descending resistance line + above 1.250, with increased volume. Ideally, a retest as support after the breakout.
* First target: 1.784 (conservative TP). If momentum is strong: 2.39 → 2.959.
* Risk management: stop loss below breakout candle or below the rising support line (e.g., entry at 1.30, stop \~1.00–1.05). Use position sizing to keep per-trade risk small (1–3% of capital).
* Significance: a break above will signal a potential *trend reversal* from long-term downtrend to accumulation/uptrend.
BEARISH Scenario (if breakdown occurs):
* Breakdown confirmation: 2D candle close below the rising support line with increased sell volume; failed retest confirms weakness.
* First target: 0.850. If selling pressure continues: 0.65 → 0.50 → 0.32.
* Risk management: if shorting, stop above retest/resistance (or above 1.25 if a failed breakout).
* Significance: since the prior long-term trend is bearish, a breakdown has high probability of trend continuation to the downside.
---
Trade Ideas
* Conservative: set alerts for 2D close > 1.25 + higher volume; partial entry, partial TP at 1.78, trail the rest.
* Aggressive: enter on breakout & retest of resistance as support.
* Bear setup: short after confirmed close below rising support & failed retest; target 0.85 first.
---
Technical & Psychological Notes:
* Pattern is very close to the apex → large move likely within the next few weeks on the 2D chart.
* Volume & candle close are key to avoid chasing fake breakouts.
* Also watch general crypto sentiment & news catalysts as they can trigger breakouts against the technical bias.
#ETHFI #Crypto #TechnicalAnalysis #Triangle #Breakout #SupportResistance #Altcoins #CryptoTrading #BullBear
✅ Get Free Signals! Join Our Telegram Channel Here: t.me/TheCryptoNuclear
✅ Twitter: twitter.com/crypto_nuclear
✅ Join Bybit : partner.bybit.com/b/nuclearvip
✅ Benefits : Lifetime Trading Fee Discount -50%
✅ Twitter: twitter.com/crypto_nuclear
✅ Join Bybit : partner.bybit.com/b/nuclearvip
✅ Benefits : Lifetime Trading Fee Discount -50%
Disclaimer
The information and publications are not meant to be, and do not constitute, financial, investment, trading, or other types of advice or recommendations supplied or endorsed by TradingView. Read more in the Terms of Use.