When trading high leverage, I need a sharp overview of the market to manage risk and take profits.
Having a parallel view of the 4H and 30min timeframes helps a lot with that.
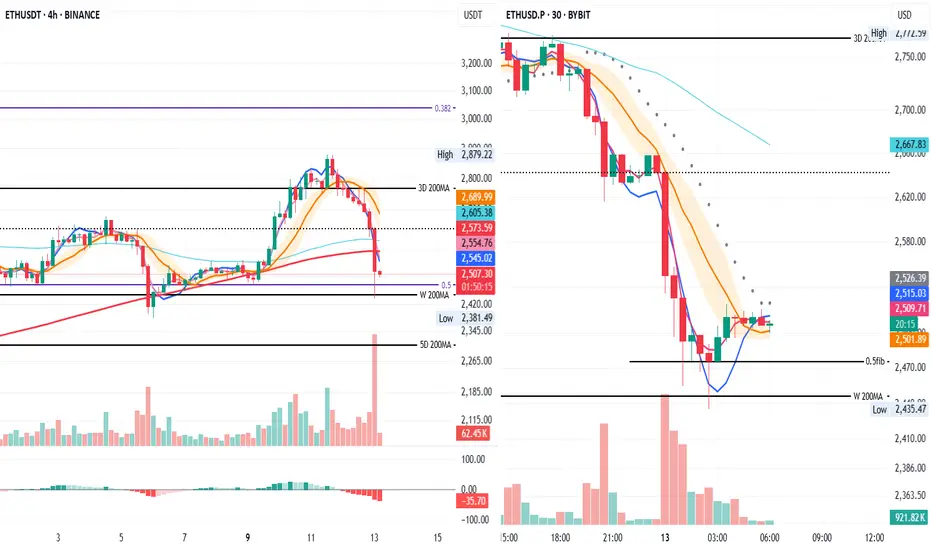
Right now, on the 30min chart, we’ve had two clean retests of key high timeframe levels:
– the 0.5 Fib
– the weekly 200MA
These retests may justify scaling into a long position, with a stop-loss placed just below the 0.5 Fib or the weekly 200MA.
The structure (MLR > SMA > BB center) supports a long entry, but PSAR hasn’t flipped bullish yet, so this setup requires caution—especially if price starts closing below these levels. If that happens, it’s better to wait before scaling in.
On the 4H timeframe, selling volume spiked on the last candle, but keep in mind:
→ 3D volume bars have been decreasing, suggesting selling pressure might be weakening overall.
I’ll do my best to keep consistent updates on this parallel timeframe view—it’s proving to be very helpful.
Always take profits and manage risk.
Interaction is welcome.
Related publications
Disclaimer
The information and publications are not meant to be, and do not constitute, financial, investment, trading, or other types of advice or recommendations supplied or endorsed by TradingView. Read more in the Terms of Use.
Related publications
Disclaimer
The information and publications are not meant to be, and do not constitute, financial, investment, trading, or other types of advice or recommendations supplied or endorsed by TradingView. Read more in the Terms of Use.