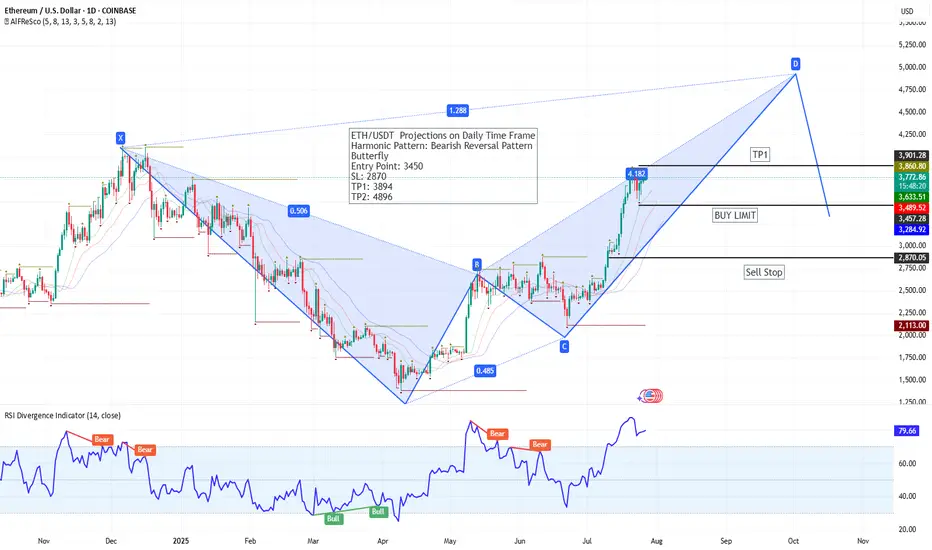
@ Eth/USDT Daily time frame A potential Bearish Butterfly harmonic pattern is unfolding on the daily timeframe. Price is currently approaching the D point completion zone, projecting a reversal area near 4896.
📌 Trade Setup:
Buy Limit: 3450
Stop Loss: 2870
TP1: 3894
TP2: 4896
RSI is approaching overbought levels (currently 79.57), suggesting caution as price nears the harmonic resistance zone. If price completes the pattern near TP2, traders can watch for a potential bearish reversal opportunity.
Pattern aligns with historical RSI divergences and prior structure. Monitor price action closely as we approach the D point.
Disclaimer
The information and publications are not meant to be, and do not constitute, financial, investment, trading, or other types of advice or recommendations supplied or endorsed by TradingView. Read more in the Terms of Use.
Disclaimer
The information and publications are not meant to be, and do not constitute, financial, investment, trading, or other types of advice or recommendations supplied or endorsed by TradingView. Read more in the Terms of Use.