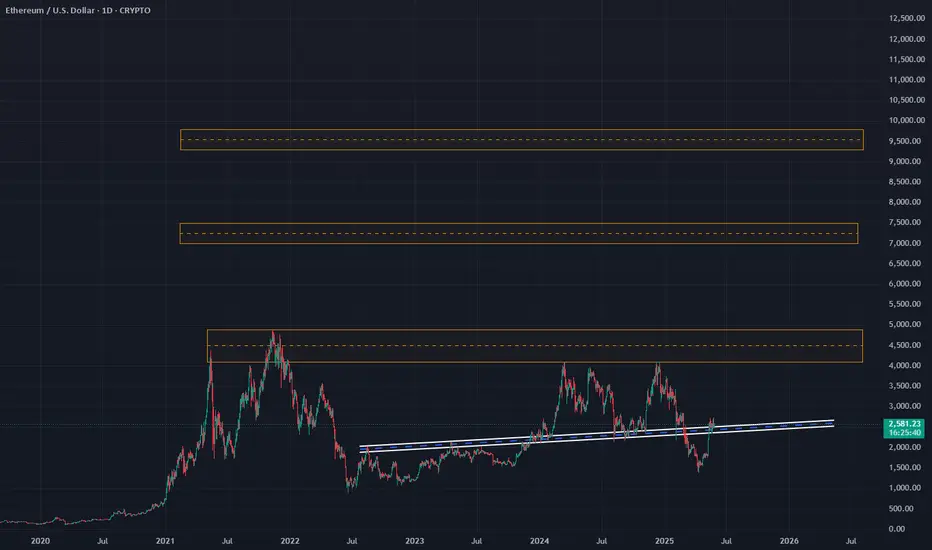
This chart illustrates Ethereum’s price action on the daily timeframe, showcasing a clear structural outlook based on historical price behavior and major resistance zones.
Ascending Trendline Support: ETH is currently respecting a long-term ascending trendline (white and blue lines), which has acted as dynamic support since mid-2022. Despite temporary breakdowns, price has re-entered this channel, suggesting bullish momentum is attempting a recovery.
Key Resistance Zones:
$4,000 – $4,800: This is the nearest major resistance area, highlighted by past cycle tops. ETH must decisively break above this zone to confirm a macro bullish continuation.
$6,800 – $7,600: A significant mid-cycle resistance from historical price action, likely to serve as the next major target upon breakout.
$9,200 – $10,000: The final upper target zone on this chart, representing psychological and technical resistance if ETH enters a strong bull market phase.
Current Price: As of today, ETH is trading around $2,580 with a +1.09% daily gain, suggesting a potential continuation towards the first resistance zone.
This analysis suggests that Ethereum is attempting a macro reversal, and reclaiming the ascending channel strengthens the bullish case. However, multiple resistance levels remain overhead, which will require strong volume and market sentiment to overcome.
Disclaimer
The information and publications are not meant to be, and do not constitute, financial, investment, trading, or other types of advice or recommendations supplied or endorsed by TradingView. Read more in the Terms of Use.
Disclaimer
The information and publications are not meant to be, and do not constitute, financial, investment, trading, or other types of advice or recommendations supplied or endorsed by TradingView. Read more in the Terms of Use.