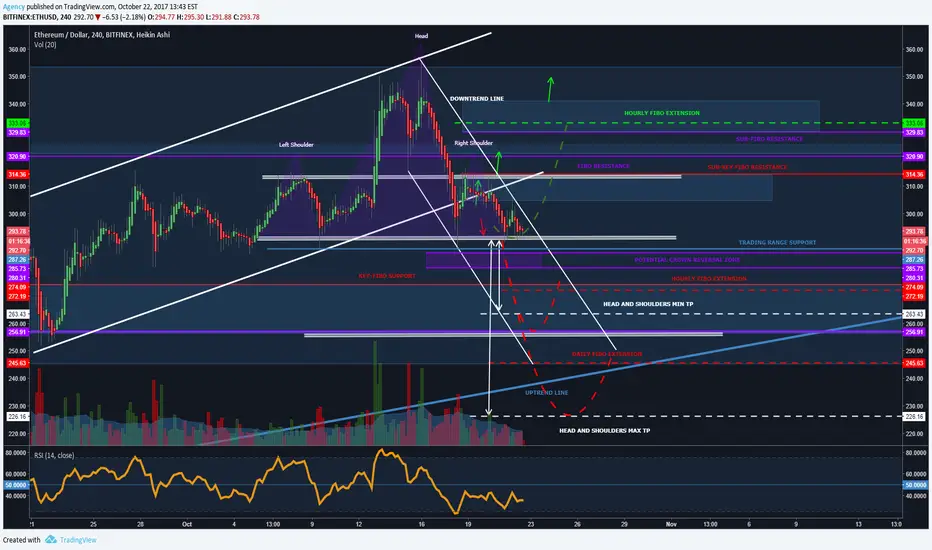
If Ethereum fails to break the downtrend line and breaks through its current support level, it looks like we will gear up for an upright head and shoulders pattern. This pattern gives us two targets to the downside. A MIN TP at $263.43 and a MAX TP at $226.16. Wait for a break and close of the trading range support at $287 on the 1HR. Keep in mind the hourly and daily fibo extensions on the chart, along with the uptrend line that can reverse the market. If the uptrend line is breached, we may have further shorting opportunities.
Alternatively, if we break the downtrend line and move upward, we could hit the hourly fibo extension at $333.06. Lots of resistance up there now, though. The ETHBTC also indicates further weakness in this instrument as it descends against BTC in a falling wedge pattern. This wedge may breakout to the downside.

Cheers and GLWT!
-Erik
Alternatively, if we break the downtrend line and move upward, we could hit the hourly fibo extension at $333.06. Lots of resistance up there now, though. The ETHBTC also indicates further weakness in this instrument as it descends against BTC in a falling wedge pattern. This wedge may breakout to the downside.
Cheers and GLWT!
-Erik
Note
At the fibo extensionNote
Breakout! Lets wait for a pattern... interesting reaction to the BTCUSD selloff.Note
Hmmmm....flag to the extension target? This would invalidate the head and shoulders pattern.4HR view. Don't forget this could be a downward channel:
Note
No boost in the alts from the current BTC selloff... This casts doubt on the whole "rotation" thesis floating around. You don't get "rotation" when 5 billion leaves the sector.coinmarketcap.com/charts/
Note
Note
Bear pennant on the 1HR?Note
It might want to go the other way again....Note
Broke to the upside! But, who cares?Still very bearish in this context
Note
RSI is making a sell signal...we also kissed the top of the descending channel.Back in the falling wedge here:
Note
Note
I never entered that short since BTC is going so strong...We broke the trading range support in this chart, but there is a fibo support coming up. This might push ETHUSD up as long as BTCUSD is stable or upward.
Note
Down to the key fibo/ major fibo support?Note
Here we go?Note
Still short... Could get a big selloff in the ETHBTC chart...Related publications
Disclaimer
The information and publications are not meant to be, and do not constitute, financial, investment, trading, or other types of advice or recommendations supplied or endorsed by TradingView. Read more in the Terms of Use.
Related publications
Disclaimer
The information and publications are not meant to be, and do not constitute, financial, investment, trading, or other types of advice or recommendations supplied or endorsed by TradingView. Read more in the Terms of Use.