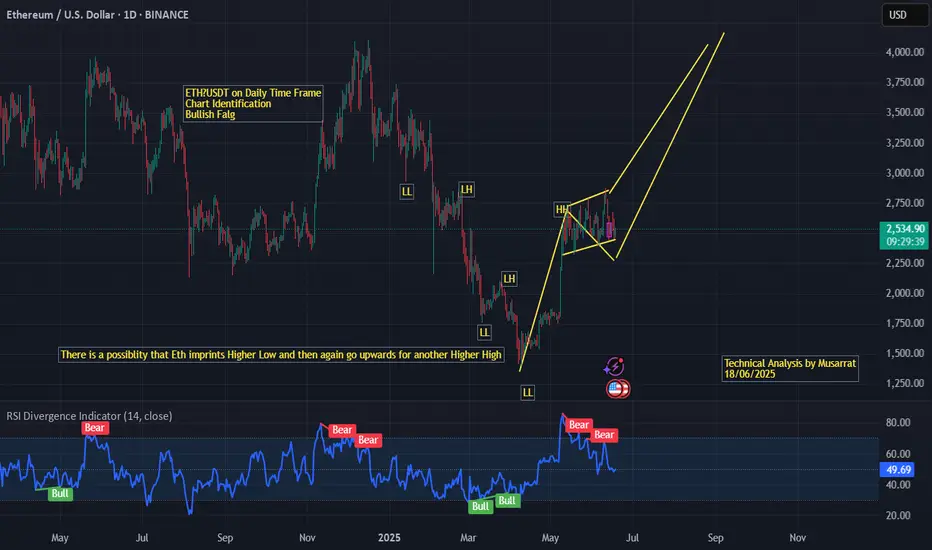
The chart shows Ethereum forming a bullish flag pattern after a strong upward rally, indicating potential continuation of the bullish trend. The recent price structure reflects a consolidation phase in a downward-sloping flag, following a significant impulsive move.
Key highlights:
The sequence of Higher Highs (HH) and Higher Lows (HL) suggests a shift in trend structure.
The current flag pattern aligns with the textbook characteristics of a bullish continuation setup.
RSI shows previous bullish divergence, supporting the case for upward momentum resumption.
🔸 Outlook: If ETH prints another higher low and breaks above the flag resistance, it may surge toward a new higher high in the $3,000–$3,500 zone.
Disclaimer
The information and publications are not meant to be, and do not constitute, financial, investment, trading, or other types of advice or recommendations supplied or endorsed by TradingView. Read more in the Terms of Use.
Disclaimer
The information and publications are not meant to be, and do not constitute, financial, investment, trading, or other types of advice or recommendations supplied or endorsed by TradingView. Read more in the Terms of Use.