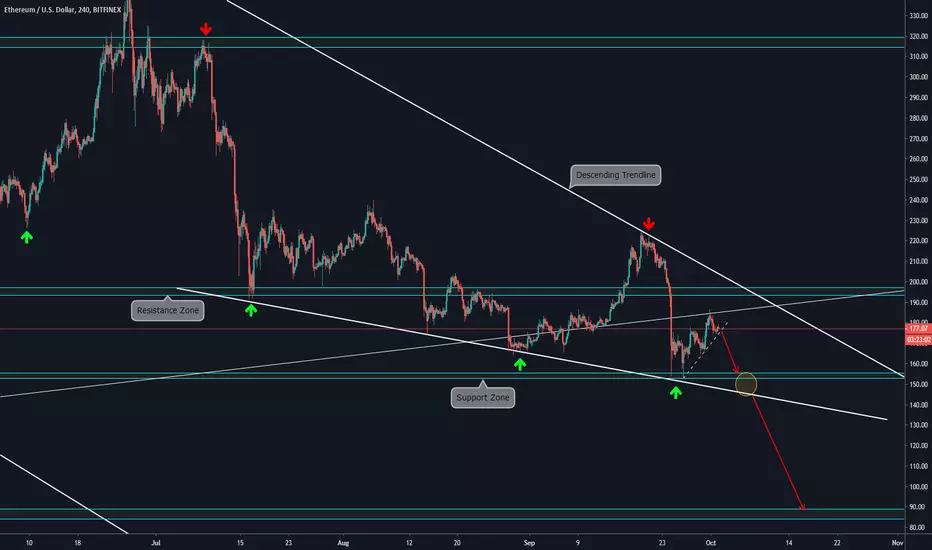
4H CHART EXPLANATION:
At this timeframe we observe that price is making a corrective structrure of the last downside movement. If this structure is broken downwards, then price should break the confluence zone between the last bottom and the Trendline to have free way to the next Support Zone at $85.
DAILY CHART EXPLANATION:
Disclaimer
The information and publications are not meant to be, and do not constitute, financial, investment, trading, or other types of advice or recommendations supplied or endorsed by TradingView. Read more in the Terms of Use.
Disclaimer
The information and publications are not meant to be, and do not constitute, financial, investment, trading, or other types of advice or recommendations supplied or endorsed by TradingView. Read more in the Terms of Use.