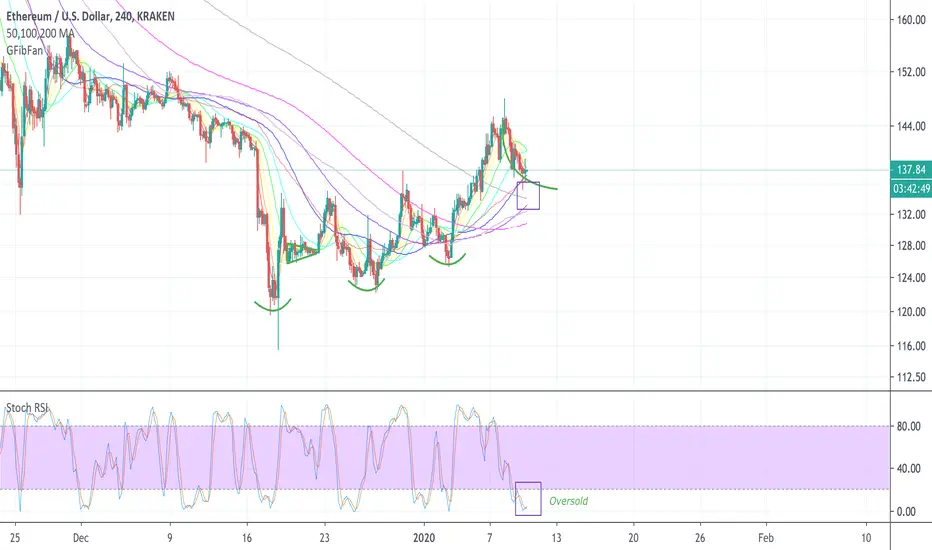
ETHUSD has formed a small descending scallop, higher lows are also present. Key level is grey Fibonacci line. Stock RSI can be seen to be oversold. 4hr chart can often be less reliable than greater timeframe charts.
Disclaimer
The information and publications are not meant to be, and do not constitute, financial, investment, trading, or other types of advice or recommendations supplied or endorsed by TradingView. Read more in the Terms of Use.
Disclaimer
The information and publications are not meant to be, and do not constitute, financial, investment, trading, or other types of advice or recommendations supplied or endorsed by TradingView. Read more in the Terms of Use.