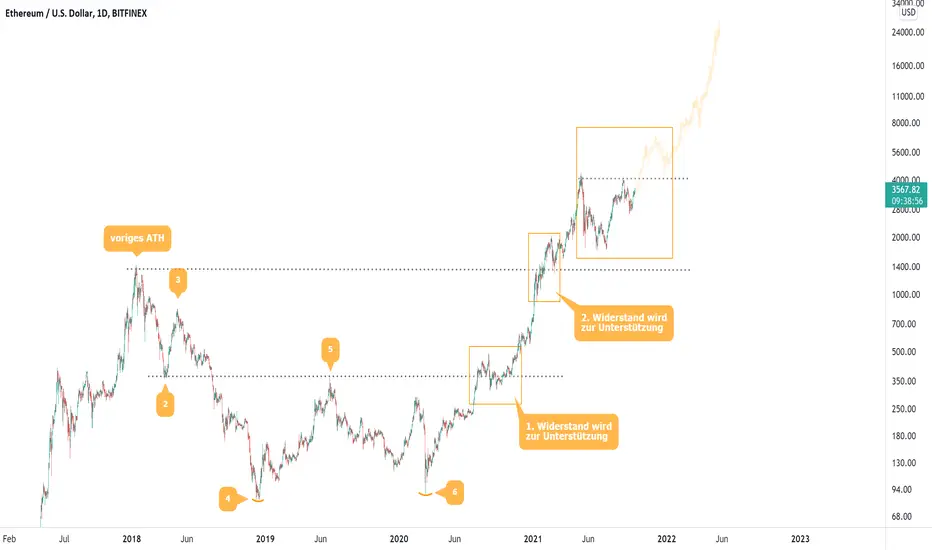
Since pictures are worth a thousand words, just compare the Ethereum price trend shown here with that of Bitcoin between 2013 and 2018.
https://tradingview.sweetlogin.com/x/WwLfgGiu/
I was inspired by a chart I saw at @InmortalTechnique.
Credit goes to the owner of the original idea.
https://tradingview.sweetlogin.com/x/WwLfgGiu/
I was inspired by a chart I saw at @InmortalTechnique.
Credit goes to the owner of the original idea.
Note
Ok, I see. I forgot to translate what is written in the speech bubbles. It just says that previous resistances have turned into supports. CheersRelated publications
Disclaimer
The information and publications are not meant to be, and do not constitute, financial, investment, trading, or other types of advice or recommendations supplied or endorsed by TradingView. Read more in the Terms of Use.
Related publications
Disclaimer
The information and publications are not meant to be, and do not constitute, financial, investment, trading, or other types of advice or recommendations supplied or endorsed by TradingView. Read more in the Terms of Use.