ETHUSDT Technical analysis update
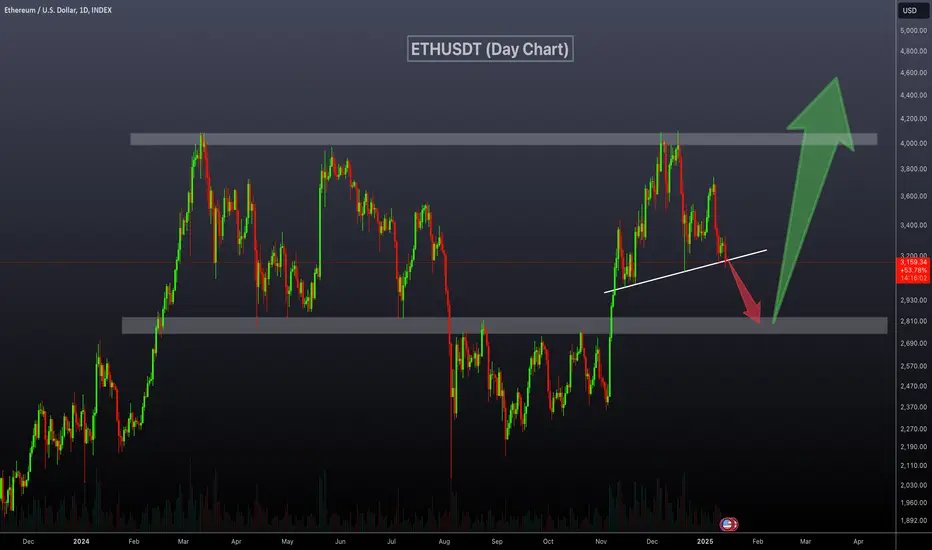
ETHUSDT has been trading within the same range of $2,000–$4,000 for the past 400 days. Currently, the price is forming an inverse head and shoulders pattern. In the coming days, the price could create the right shoulder of this pattern. A possible drop to the strong support zone at $2,700–$2,800 could complete the right shoulder formation. Once the price touches this support level, we can expect a strong bounce from that area.
Good Buy level: $2700- $2800
Regards
Hexa
🚀Telegram : t.me/hexatrades
🌐Website: hexatrades.io/
🗣️Twitter(X): twitter.com/HexaTrades
🌐Website: hexatrades.io/
🗣️Twitter(X): twitter.com/HexaTrades
Related publications
Disclaimer
The information and publications are not meant to be, and do not constitute, financial, investment, trading, or other types of advice or recommendations supplied or endorsed by TradingView. Read more in the Terms of Use.