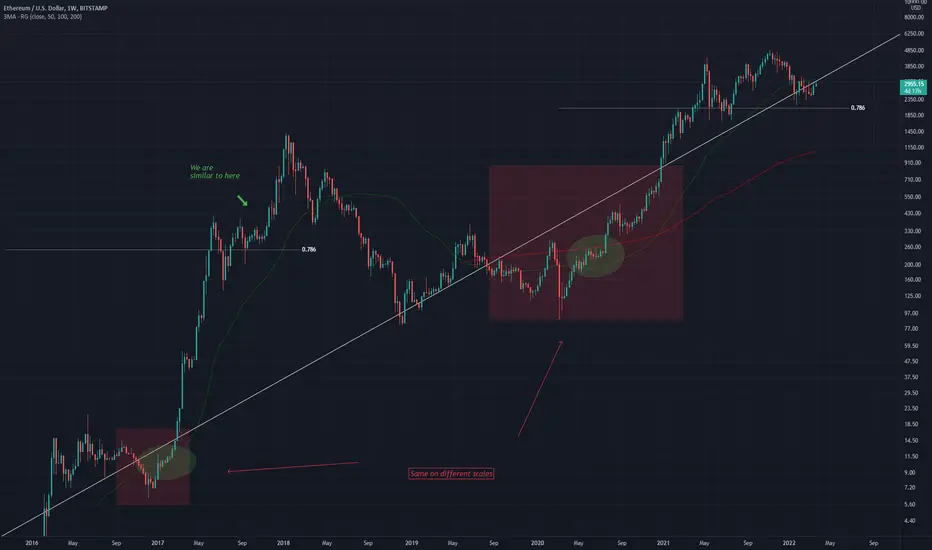
White trendline through the middle of both bull and bear cycle is dominant
using moving averages we can estimate where we are in the bull run
The red squares are similar formations, different places in time
Within the smaller square you can see the price brush against the 50MA
Within the larger square you can see the price brush against the 200MA
Using Fibonacci retracement we can see we are at 0.786 level which leaves one pump remaining until we top out for this cycle
Disclaimer
The information and publications are not meant to be, and do not constitute, financial, investment, trading, or other types of advice or recommendations supplied or endorsed by TradingView. Read more in the Terms of Use.
Disclaimer
The information and publications are not meant to be, and do not constitute, financial, investment, trading, or other types of advice or recommendations supplied or endorsed by TradingView. Read more in the Terms of Use.