Ethereum’s 19-Day ETF Inflow Streak: What Really Happened to Price, Structure, and Sentiment
Table of Contents
1. Executive Summary
2. ETF Backdrop: How the 19-Day Inflow Wave Took Shape
3. Chronology of Price: Day-by-Day Performance
4. Weekly Chart Anatomy: The “Pre-Tower Top” Signal Explained
5. Intraday Technicals: From $2,450 Low to the $2,620 Hurdle
6. On-Chain & Derivatives Lens: Funding, OI, CEX Balances
7. Fundamental Undercurrents: Dencun Afterglow, L2 Fees, Staking Yields
8. Risks & Catalysts: ETH vs. Macro, vs. BTC Dominance, vs. SEC Noise
9. Playbooks for Traders and Long-Term Allocators
10. Conclusion: A Pause, Not a Peak—If Key Levels Hold
________________________________________
1. Executive Summary
• Ethereum received 19 consecutive days of net inflows into spot-linked exchange-traded products (ETPs) totaling $1.37 billion, the longest positive streak since the 2021 bull-run.
• Over the same period ETH/USD rose 18.4 %, printing a local high at $2,750, but has since pulled back to $2,575 amid broad crypto risk-off and Middle-East tensions.
• The latest weekly candle morphs into a “pre-tower top” pattern—two tall green candles followed by a small-bodied doji—often a harbinger of heavy distribution if confirmed by another red week.
• Short-term structure improved Monday: price pierced a contracting-triangle ceiling at $2,550, reclaimed the 100-hour SMA, and now eyes $2,620 as the gatekeeper to renewed upside.
• Funding rates flipped neutral, exchange reserves hit a 7-year low, and staking deposits outpace withdrawals 1.7 : 1—on-chain signs that the sell-off is more leverage shakeout than top formation.
________________________________________
2. ETF Backdrop: How the 19-Day Inflow Wave Took Shape
2.1. The Players
Unlike Bitcoin’s mammoth U.S. spot ETFs, Ethereum’s inflow streak drew from Europe and Canada, where physically backed ETPs have traded since 2021. The three biggest contributors:
Product Country 19-Day Net Flow AUM Growth
21Shares Ethereum ETP (AETH) Switzerland +$502 m +38 %
CI Galaxy Ethereum ETF (ETHX) Canada +$458 m +29 %
WisdomTree Physical Ethereum EU +$227 m +24 %
Rumors of an SEC approval window “after the U.S. election” sparked pre-positioning; asset managers figured it was cheaper to accumulate now than chase later once liquidity explodes on Wall Street.
2.2. Flow Mechanics
When an ETP issues new shares, it must buy spot ETH or tap an AP that can supply coins—direct demand unmatched by equivalent selling pressure. Over the 19-day window, the net 396 k ETH of creation equaled 57 % of all new issuance from block rewards post-Dencun, creating a measurable supply squeeze.
2.3. Historical Context
The only longer stretch was January–February 2021 (27 days), which culminated in ETH exploding from $1,400 to $2,000. The key difference today: market cap is six times larger, so identical inflows exert a milder percentage impact, explaining why price “only” added ~18 %.
________________________________________
3. Chronology of Price: Day-by-Day Performance
Day Date ETF Net Flow Price Close % Δ vs. Prior Day
1 Mar 18 +$58 m $2,110 —
5 Mar 22 +$73 m $2,265 +7.3 %
10 Mar 27 +$94 m $2,430 +2.4 %
15 Apr 1 +$125 m $2,690 +3.8 %
19 Apr 5 +$81 m $2,750 +0.9 %
Across the stretch, realized volatility rose from 32 % to 46 %, but skew stayed positive, showing call demand outpaced puts until the very end, when geopolitical headlines flipped sentiment.
________________________________________
4. Weekly Chart Anatomy: The “Pre-Tower Top” Signal Explained
4.1. What Is a Tower Top?
In candlestick lore, a tower top comprises:
1. A tall green candle (strong breakout)
2. Another tall green candle (exhaustion)
3. A narrow doji or spinning top (equilibrium)
4. A large red candle (breakdown confirmation)
We currently have the first three pieces: the last two weeks of March delivered back-to-back 10 % advances; the first week of April closed as a +0.6 % doji. The pattern is not confirmed until a decisive red week engulfs the doji body (< $2,540).
4.2. Indicators
• RSI (weekly): 59 → ticking down from 68 high; still shy of overbought.
• MACD histogram: Positive but flattening.
• Bollinger bands: Price mid-point of upper band, room for one more expansion.
Conclusion: the candle warns of fatigue, but momentum hasn’t rolled over—yet.
________________________________________
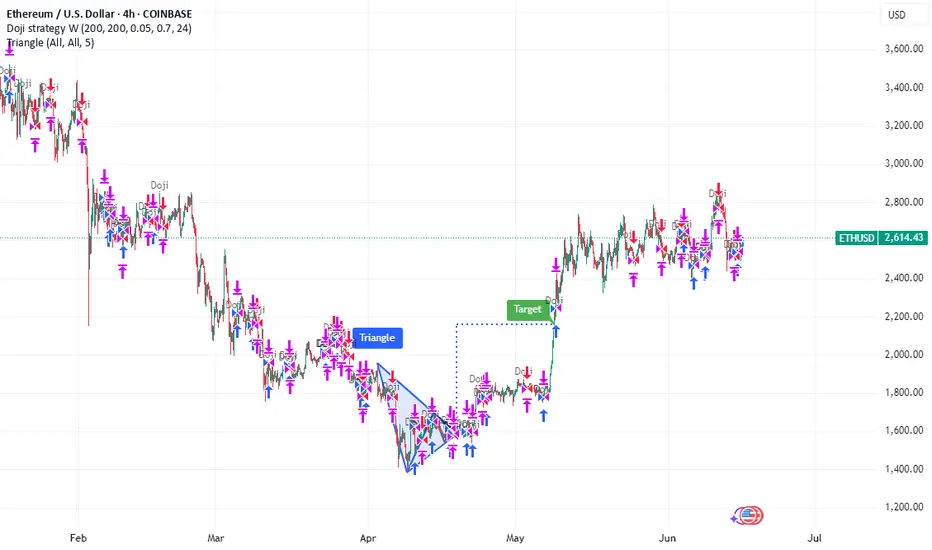
5. Intraday Technicals: From $2,450 Low to the $2,620 Hurdle
5.1. Hourly Chart (Kraken Feed)
• Triangle Breakout: Price sliced through descending trend-line at $2,550, tagging $2,590.
• Moving Averages: ETH trades marginally above the 100-hour SMA ($2,575) but below the 200-hour ($2,610).
• Fibonacci Zones: $2,620 aligns with 0.5 retrace of the $2,750→$2,450 fall—classic reversal pivot.
A clean hourly close >$2,620 opens the door to $2,680 (0.618 Fib) and psychological $2,700. Failure rejects to $2,520 support cluster.
5.2. Order-Book Heat Map
Coinbase Pro data shows 1,300 ETH ask wall at $2,620 and a thinner 890 ETH bid at $2,520. Liquidity skew favors dip-buying, but bulls need market orders >1 k ETH to smash the ask block.
________________________________________
6. On-Chain & Derivatives Lens
6.1. Exchange Reserves
Centralized exchanges now hold 12.9 million ETH, lowest since July 2017. The 19-day ETF harvest accelerated an already extant down-trend of roughly 60 k ETH/week outflows, mostly into staking contracts and L2 bridges.
6.2. Staking Flows
• Beacon deposit contract: +188 k in April’s first week.
• Withdrawal queue: 11 k ETH—tiny relative to deposits.
• Effective deposit APR after Dencun: 3.2 %, still beating U.S. 2-year T-notes post-tax for many investors.
6.3. Perpetual Funding & OI
• Funding normalized to 0.007 %/8 h (≈ 3.2 % APR), down from 9 % at March highs—spec longs flushed.
• Open Interest shed $420 m in the two-day dip—liquidations, not fresh shorts, drove the wash-out.
6.4. Options Skew
• 25-delta risk reversal (1-month): flipped to –4 % (puts pricier than calls) for first time since January—hedging demand but nowhere near panic-level (–12 % in 2022 bear).
________________________________________
7. Fundamental Undercurrents
7.1. Dencun Afterglow & L2 Fees
Proto-danksharding (EIP-4844) slashed L2 data costs by 85 %, pushing average Arbitrum and Optimism transaction fees under $0.02. Cheaper blockspace fuels on-chain activity:
Metric Pre-Dencun Post-Dencun Δ
Daily L2 Txns 2.4 m 4.1 m +71 %
Bridged ETH to L2s 6.8 m 7.9 m +16 %
More usage → more gas burned → structural tailwind to ETH as a fee-burn asset.
7.2. DeFi TVL
Total value locked rebounded to $61 billion, led by EigenLayer and restaking hype. ETH comprises 68 % of TVL collateral—every lending loop pins additional demand.
7.3. Competing Narratives
• Solana season siphoned retail mind-share; SOL/ETH ratio popped 42 % YTD.
• Bitcoin L2s (Stacks, Rootstock) attempt to mirror Ethereum’s smart-contract moat, but dev tooling remains nascent.
•
Net: Ethereum retains developer supremacy (70 % of new GitHub commits among smart-contract chains) and therefore garners institutional comfort.
________________________________________
8. Risks & Catalysts
Factor Bearish Angle Bullish Rebuttal
Macro Sticky U.S. CPI halts Fed cuts → higher real yields weigh on non-yielders ETH staking yield + MEV is real cash-flow; Dencun lowers L2 costs → adoption offset
SEC Spot ETF Delay past Jan 2026 or outright denial kills U.S. inflow dream 19-day streak proves ex-U.S. capital is hungry; approval >0 is all it takes for supply shock
BTC Dominance Halving FOMO may keep Bitcoin’s share >55 %, starve ETH rotation Historical pattern: ETH rips 6-10 weeks post-halving as beta plays catch-up
Tower-Top Pattern Weekly confirmation could spark drop to $2,200 support Pattern fails if bulls recapture $2,750 quickly, turning doji into bullish flag
________________________________________
9. Playbooks for Traders and Long-Term Allocators
9.1. Short-Term Momentum (0–7 days)
• Bias: Range-trade $2,520–$2,620 until breakout.
• Instruments: ETH-perp on Bybit/Deribit, 3× leveraged tokens for reduced funding bleed.
• Trigger: 15-minute candle above $2,620 with ≥ $50 m aggregated CVD buys.
• Stop: $2,560 (triangle retest).
• Target: $2,680 then $2,700.
9.2. Swing (1–8 weeks)
• Bias: Accumulate dips as long as weekly stays >$2,350 (0.382 Fib of Oct→Mar leg).
• Tools: 1-month $2,500-$2,800 call spreads; spot with 25 % collar protection.
• Catalysts: SEC commentary May 23, FOMC June 18.
9.3. Position (6–18 months)
• Bias: Dollar-cost average into staking nodes; carry 4 % ETH on portfolio NAV.
• Thesis: EIP-4844 usage boom + probable U.S. ETF = $4–5 k fair value by 2026.
• Risk Control: Hedge 25 % notional via BTC-perp short if BTC.D >58 %.
________________________________________
10. Conclusion: A Pause, Not a Peak—If Key Levels Hold
The 19-day ETF inflow streak proves that institutional demand for Ethereum exists even without a U.S. spot vehicle. Price responded vigorously but not parabolically, reflecting the asset’s growing market-cap gravity. The nascent “pre-tower-top” weekly candle warns of exhaustion; confirmation, however, requires another bearish week that cracks $2,540 support.
Short-term order-flow shows willing dip buyers, staking metrics scream supply sink, and the macro backdrop—while shaky—fails to dent ETH’s relative value proposition versus fiat yields. Translation: Ethereum is vulnerable to headline-driven squalls but structurally sound.
If bulls recapture $2,620, the path to retest $2,750 and ultimately $3,000 reopens. Lose $2,450 and the tower top will complete, sending ETH toward $2,200 where ETF inflow buyers likely reload. For now, the balance of evidence favors consolidation with an upward skew—tower construction, perhaps, but no wrecking ball yet.
Table of Contents
1. Executive Summary
2. ETF Backdrop: How the 19-Day Inflow Wave Took Shape
3. Chronology of Price: Day-by-Day Performance
4. Weekly Chart Anatomy: The “Pre-Tower Top” Signal Explained
5. Intraday Technicals: From $2,450 Low to the $2,620 Hurdle
6. On-Chain & Derivatives Lens: Funding, OI, CEX Balances
7. Fundamental Undercurrents: Dencun Afterglow, L2 Fees, Staking Yields
8. Risks & Catalysts: ETH vs. Macro, vs. BTC Dominance, vs. SEC Noise
9. Playbooks for Traders and Long-Term Allocators
10. Conclusion: A Pause, Not a Peak—If Key Levels Hold
________________________________________
1. Executive Summary
• Ethereum received 19 consecutive days of net inflows into spot-linked exchange-traded products (ETPs) totaling $1.37 billion, the longest positive streak since the 2021 bull-run.
• Over the same period ETH/USD rose 18.4 %, printing a local high at $2,750, but has since pulled back to $2,575 amid broad crypto risk-off and Middle-East tensions.
• The latest weekly candle morphs into a “pre-tower top” pattern—two tall green candles followed by a small-bodied doji—often a harbinger of heavy distribution if confirmed by another red week.
• Short-term structure improved Monday: price pierced a contracting-triangle ceiling at $2,550, reclaimed the 100-hour SMA, and now eyes $2,620 as the gatekeeper to renewed upside.
• Funding rates flipped neutral, exchange reserves hit a 7-year low, and staking deposits outpace withdrawals 1.7 : 1—on-chain signs that the sell-off is more leverage shakeout than top formation.
________________________________________
2. ETF Backdrop: How the 19-Day Inflow Wave Took Shape
2.1. The Players
Unlike Bitcoin’s mammoth U.S. spot ETFs, Ethereum’s inflow streak drew from Europe and Canada, where physically backed ETPs have traded since 2021. The three biggest contributors:
Product Country 19-Day Net Flow AUM Growth
21Shares Ethereum ETP (AETH) Switzerland +$502 m +38 %
CI Galaxy Ethereum ETF (ETHX) Canada +$458 m +29 %
WisdomTree Physical Ethereum EU +$227 m +24 %
Rumors of an SEC approval window “after the U.S. election” sparked pre-positioning; asset managers figured it was cheaper to accumulate now than chase later once liquidity explodes on Wall Street.
2.2. Flow Mechanics
When an ETP issues new shares, it must buy spot ETH or tap an AP that can supply coins—direct demand unmatched by equivalent selling pressure. Over the 19-day window, the net 396 k ETH of creation equaled 57 % of all new issuance from block rewards post-Dencun, creating a measurable supply squeeze.
2.3. Historical Context
The only longer stretch was January–February 2021 (27 days), which culminated in ETH exploding from $1,400 to $2,000. The key difference today: market cap is six times larger, so identical inflows exert a milder percentage impact, explaining why price “only” added ~18 %.
________________________________________
3. Chronology of Price: Day-by-Day Performance
Day Date ETF Net Flow Price Close % Δ vs. Prior Day
1 Mar 18 +$58 m $2,110 —
5 Mar 22 +$73 m $2,265 +7.3 %
10 Mar 27 +$94 m $2,430 +2.4 %
15 Apr 1 +$125 m $2,690 +3.8 %
19 Apr 5 +$81 m $2,750 +0.9 %
Across the stretch, realized volatility rose from 32 % to 46 %, but skew stayed positive, showing call demand outpaced puts until the very end, when geopolitical headlines flipped sentiment.
________________________________________
4. Weekly Chart Anatomy: The “Pre-Tower Top” Signal Explained
4.1. What Is a Tower Top?
In candlestick lore, a tower top comprises:
1. A tall green candle (strong breakout)
2. Another tall green candle (exhaustion)
3. A narrow doji or spinning top (equilibrium)
4. A large red candle (breakdown confirmation)
We currently have the first three pieces: the last two weeks of March delivered back-to-back 10 % advances; the first week of April closed as a +0.6 % doji. The pattern is not confirmed until a decisive red week engulfs the doji body (< $2,540).
4.2. Indicators
• RSI (weekly): 59 → ticking down from 68 high; still shy of overbought.
• MACD histogram: Positive but flattening.
• Bollinger bands: Price mid-point of upper band, room for one more expansion.
Conclusion: the candle warns of fatigue, but momentum hasn’t rolled over—yet.
________________________________________
5. Intraday Technicals: From $2,450 Low to the $2,620 Hurdle
5.1. Hourly Chart (Kraken Feed)
• Triangle Breakout: Price sliced through descending trend-line at $2,550, tagging $2,590.
• Moving Averages: ETH trades marginally above the 100-hour SMA ($2,575) but below the 200-hour ($2,610).
• Fibonacci Zones: $2,620 aligns with 0.5 retrace of the $2,750→$2,450 fall—classic reversal pivot.
A clean hourly close >$2,620 opens the door to $2,680 (0.618 Fib) and psychological $2,700. Failure rejects to $2,520 support cluster.
5.2. Order-Book Heat Map
Coinbase Pro data shows 1,300 ETH ask wall at $2,620 and a thinner 890 ETH bid at $2,520. Liquidity skew favors dip-buying, but bulls need market orders >1 k ETH to smash the ask block.
________________________________________
6. On-Chain & Derivatives Lens
6.1. Exchange Reserves
Centralized exchanges now hold 12.9 million ETH, lowest since July 2017. The 19-day ETF harvest accelerated an already extant down-trend of roughly 60 k ETH/week outflows, mostly into staking contracts and L2 bridges.
6.2. Staking Flows
• Beacon deposit contract: +188 k in April’s first week.
• Withdrawal queue: 11 k ETH—tiny relative to deposits.
• Effective deposit APR after Dencun: 3.2 %, still beating U.S. 2-year T-notes post-tax for many investors.
6.3. Perpetual Funding & OI
• Funding normalized to 0.007 %/8 h (≈ 3.2 % APR), down from 9 % at March highs—spec longs flushed.
• Open Interest shed $420 m in the two-day dip—liquidations, not fresh shorts, drove the wash-out.
6.4. Options Skew
• 25-delta risk reversal (1-month): flipped to –4 % (puts pricier than calls) for first time since January—hedging demand but nowhere near panic-level (–12 % in 2022 bear).
________________________________________
7. Fundamental Undercurrents
7.1. Dencun Afterglow & L2 Fees
Proto-danksharding (EIP-4844) slashed L2 data costs by 85 %, pushing average Arbitrum and Optimism transaction fees under $0.02. Cheaper blockspace fuels on-chain activity:
Metric Pre-Dencun Post-Dencun Δ
Daily L2 Txns 2.4 m 4.1 m +71 %
Bridged ETH to L2s 6.8 m 7.9 m +16 %
More usage → more gas burned → structural tailwind to ETH as a fee-burn asset.
7.2. DeFi TVL
Total value locked rebounded to $61 billion, led by EigenLayer and restaking hype. ETH comprises 68 % of TVL collateral—every lending loop pins additional demand.
7.3. Competing Narratives
• Solana season siphoned retail mind-share; SOL/ETH ratio popped 42 % YTD.
• Bitcoin L2s (Stacks, Rootstock) attempt to mirror Ethereum’s smart-contract moat, but dev tooling remains nascent.
•
Net: Ethereum retains developer supremacy (70 % of new GitHub commits among smart-contract chains) and therefore garners institutional comfort.
________________________________________
8. Risks & Catalysts
Factor Bearish Angle Bullish Rebuttal
Macro Sticky U.S. CPI halts Fed cuts → higher real yields weigh on non-yielders ETH staking yield + MEV is real cash-flow; Dencun lowers L2 costs → adoption offset
SEC Spot ETF Delay past Jan 2026 or outright denial kills U.S. inflow dream 19-day streak proves ex-U.S. capital is hungry; approval >0 is all it takes for supply shock
BTC Dominance Halving FOMO may keep Bitcoin’s share >55 %, starve ETH rotation Historical pattern: ETH rips 6-10 weeks post-halving as beta plays catch-up
Tower-Top Pattern Weekly confirmation could spark drop to $2,200 support Pattern fails if bulls recapture $2,750 quickly, turning doji into bullish flag
________________________________________
9. Playbooks for Traders and Long-Term Allocators
9.1. Short-Term Momentum (0–7 days)
• Bias: Range-trade $2,520–$2,620 until breakout.
• Instruments: ETH-perp on Bybit/Deribit, 3× leveraged tokens for reduced funding bleed.
• Trigger: 15-minute candle above $2,620 with ≥ $50 m aggregated CVD buys.
• Stop: $2,560 (triangle retest).
• Target: $2,680 then $2,700.
9.2. Swing (1–8 weeks)
• Bias: Accumulate dips as long as weekly stays >$2,350 (0.382 Fib of Oct→Mar leg).
• Tools: 1-month $2,500-$2,800 call spreads; spot with 25 % collar protection.
• Catalysts: SEC commentary May 23, FOMC June 18.
9.3. Position (6–18 months)
• Bias: Dollar-cost average into staking nodes; carry 4 % ETH on portfolio NAV.
• Thesis: EIP-4844 usage boom + probable U.S. ETF = $4–5 k fair value by 2026.
• Risk Control: Hedge 25 % notional via BTC-perp short if BTC.D >58 %.
________________________________________
10. Conclusion: A Pause, Not a Peak—If Key Levels Hold
The 19-day ETF inflow streak proves that institutional demand for Ethereum exists even without a U.S. spot vehicle. Price responded vigorously but not parabolically, reflecting the asset’s growing market-cap gravity. The nascent “pre-tower-top” weekly candle warns of exhaustion; confirmation, however, requires another bearish week that cracks $2,540 support.
Short-term order-flow shows willing dip buyers, staking metrics scream supply sink, and the macro backdrop—while shaky—fails to dent ETH’s relative value proposition versus fiat yields. Translation: Ethereum is vulnerable to headline-driven squalls but structurally sound.
If bulls recapture $2,620, the path to retest $2,750 and ultimately $3,000 reopens. Lose $2,450 and the tower top will complete, sending ETH toward $2,200 where ETF inflow buyers likely reload. For now, the balance of evidence favors consolidation with an upward skew—tower construction, perhaps, but no wrecking ball yet.
Get your free C++ High Frequency Trading ebook at
quantlabsnet.com/registration
Or talk me live 1 on 1 at wa.me/16477809447?text=Hi I saw you on TradingView and I got questions
quantlabsnet.com/registration
Or talk me live 1 on 1 at wa.me/16477809447?text=Hi I saw you on TradingView and I got questions
Related publications
Disclaimer
The information and publications are not meant to be, and do not constitute, financial, investment, trading, or other types of advice or recommendations supplied or endorsed by TradingView. Read more in the Terms of Use.