Hello Friends,
I will update this chart with expected targets if there is enough interest from the community. If the community wants more details, please show your interest by hitting the like icon.
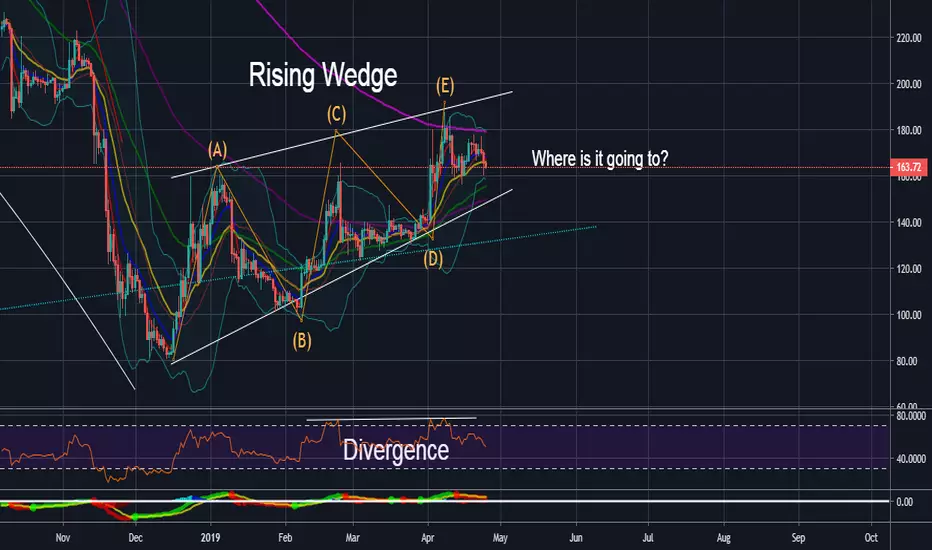
Looking at the daily chart we can see a rising wedge after a long down trend since the peek of the market. Has ETH hit bottom or is another bottom still in the cards?
All I can say at this point is the RSI has turned downward along with the MACD in tow. The RSI is showing a divergence yet there is a fractal signal giving indication to stick it out for now. The bollinger bands have turned inwards for a possible squeeze, forcing out whatever juice that remains of this trading pair. Despite the SMA golden cross and its SMA 100 predecessor, we haven't seen much action. The 50 is looking temporarily as support but the pattern will dictate the outcome as will sentiment in the market.
Looking at the weekly chart the RSI is neutral yet curling towards the bottom but the MACD is showing mixed signals and continues to climb. Volume has significantly decreased since November yet we are watching a decline in price. So which way is it going?
I have an answer but that will require an interest in the community.
Cheers!
I will update this chart with expected targets if there is enough interest from the community. If the community wants more details, please show your interest by hitting the like icon.
Looking at the daily chart we can see a rising wedge after a long down trend since the peek of the market. Has ETH hit bottom or is another bottom still in the cards?
All I can say at this point is the RSI has turned downward along with the MACD in tow. The RSI is showing a divergence yet there is a fractal signal giving indication to stick it out for now. The bollinger bands have turned inwards for a possible squeeze, forcing out whatever juice that remains of this trading pair. Despite the SMA golden cross and its SMA 100 predecessor, we haven't seen much action. The 50 is looking temporarily as support but the pattern will dictate the outcome as will sentiment in the market.
Looking at the weekly chart the RSI is neutral yet curling towards the bottom but the MACD is showing mixed signals and continues to climb. Volume has significantly decreased since November yet we are watching a decline in price. So which way is it going?
I have an answer but that will require an interest in the community.
Cheers!
Note
LOL, 9 likes...who cares. Magic poop cannon is your guy or who ever.Disclaimer
The information and publications are not meant to be, and do not constitute, financial, investment, trading, or other types of advice or recommendations supplied or endorsed by TradingView. Read more in the Terms of Use.
Disclaimer
The information and publications are not meant to be, and do not constitute, financial, investment, trading, or other types of advice or recommendations supplied or endorsed by TradingView. Read more in the Terms of Use.