The trend in the daily graph is still bearish.
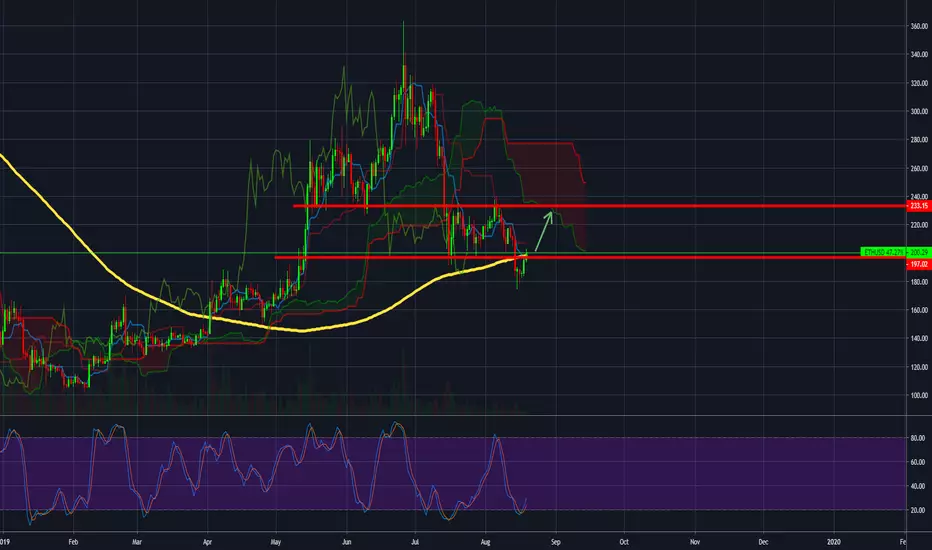
The support that broke in last week became resistance, basically the line we added in the above graph at $ 197 is used today as important resistance and currently, Ethereum is in the breaking stages of this resistance line.
The Stochastic lines are positioned at 20 which is a level that could signal a potential increase
Target: $ 233
Disclaimer
The information and publications are not meant to be, and do not constitute, financial, investment, trading, or other types of advice or recommendations supplied or endorsed by TradingView. Read more in the Terms of Use.
Disclaimer
The information and publications are not meant to be, and do not constitute, financial, investment, trading, or other types of advice or recommendations supplied or endorsed by TradingView. Read more in the Terms of Use.