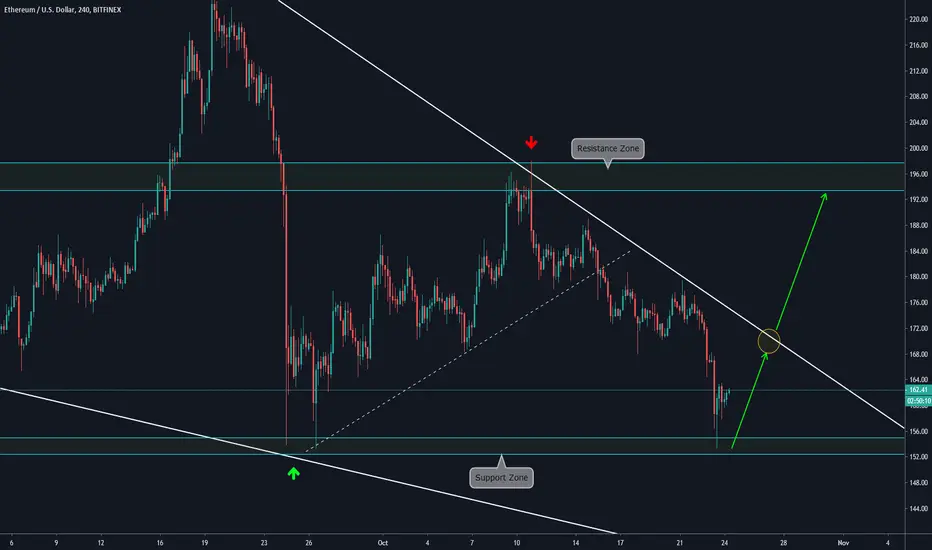
4H CHART EXPLANATION:
On this timeframe, we observe a nice bullish candlestick on the Support Zone. After that, price started moving upwards. We are now waiting for a retest of the Descending Trendline, and, if it is broken, then a corrective movement out of it that will allow us to enter to the market. The short term target is the Resistance Zone.
DAILY CHART EXPLANATION:
Disclaimer
The information and publications are not meant to be, and do not constitute, financial, investment, trading, or other types of advice or recommendations supplied or endorsed by TradingView. Read more in the Terms of Use.
Disclaimer
The information and publications are not meant to be, and do not constitute, financial, investment, trading, or other types of advice or recommendations supplied or endorsed by TradingView. Read more in the Terms of Use.