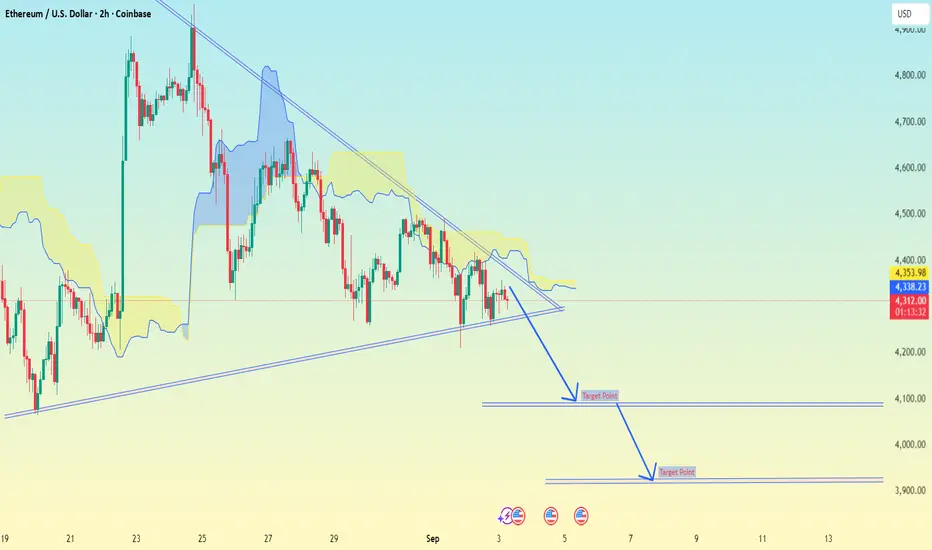
ETH/USD (Ethereum vs USD) chart (2H timeframe, Coinbase), here’s what I see:
---
📊 Setup
ETH is trading around 4,314 USD.
Price is under the Ichimoku cloud (bearish bias).
A descending triangle pattern is visible, with a support trendline below.
Your chart projection shows downside targets.
---
🎯 Target Points
First Target: ~ 4,100 USD
Second Target: ~ 3,900 USD
These are marked with blue arrows on My chart.
---
⚠ Stop-Loss Suggestion
Above 4,420 – 4,450 USD (break above resistance + cloud).
---
✅ Summary:
ETH looks bearish short-term while below the cloud and resistance.
First target: 4,100 USD
Second target: 3,900 USD
Stop-loss above 4,420 – 4,450 USD
---
📊 Setup
ETH is trading around 4,314 USD.
Price is under the Ichimoku cloud (bearish bias).
A descending triangle pattern is visible, with a support trendline below.
Your chart projection shows downside targets.
---
🎯 Target Points
First Target: ~ 4,100 USD
Second Target: ~ 3,900 USD
These are marked with blue arrows on My chart.
---
⚠ Stop-Loss Suggestion
Above 4,420 – 4,450 USD (break above resistance + cloud).
---
✅ Summary:
ETH looks bearish short-term while below the cloud and resistance.
First target: 4,100 USD
Second target: 3,900 USD
Stop-loss above 4,420 – 4,450 USD
Trade active
trade activet.me/forexofdollarsmagnet
Forex, gold and crypto signal's with detailed analysis & get consistent results..
t.me/+yJ2-qfkocRg1NDlk
Gold signal's with proper TP & SL for high profits opportunities..
Forex, gold and crypto signal's with detailed analysis & get consistent results..
t.me/+yJ2-qfkocRg1NDlk
Gold signal's with proper TP & SL for high profits opportunities..
Related publications
Disclaimer
The information and publications are not meant to be, and do not constitute, financial, investment, trading, or other types of advice or recommendations supplied or endorsed by TradingView. Read more in the Terms of Use.
t.me/forexofdollarsmagnet
Forex, gold and crypto signal's with detailed analysis & get consistent results..
t.me/+yJ2-qfkocRg1NDlk
Gold signal's with proper TP & SL for high profits opportunities..
Forex, gold and crypto signal's with detailed analysis & get consistent results..
t.me/+yJ2-qfkocRg1NDlk
Gold signal's with proper TP & SL for high profits opportunities..
Related publications
Disclaimer
The information and publications are not meant to be, and do not constitute, financial, investment, trading, or other types of advice or recommendations supplied or endorsed by TradingView. Read more in the Terms of Use.