Looking at my chart
Key Observations
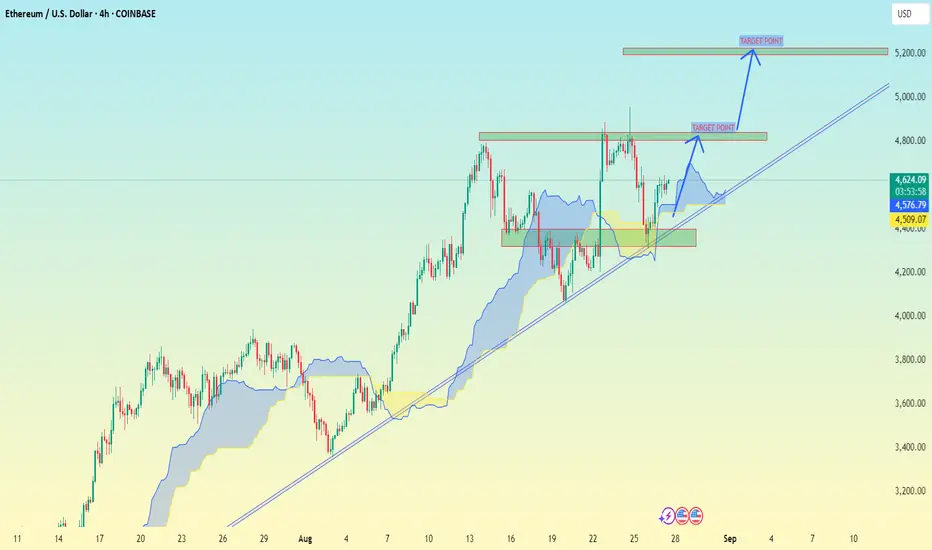
1. Trendline – Price is following a strong ascending trendline, showing bullish momentum.
2. Support Zone – Around 4,500 – 4,600 USD (highlighted yellow/blue box). Price is bouncing above this zone.
3. Breakout Point – A breakout occurred above the consolidation (around 4,800 USD).
4. Target Zones –
First Target: ~4,950 – 5,000 USD (first green box labeled "TARGET POINT").
Second Target: ~5,200 USD (upper green box labeled "TARGET POINT").
Target Projection
Immediate Target: ~4,950 – 5,000 USD
Extended Target: ~5,200 USD if momentum continues and price holds above support.
⚠ Important: If price breaks below the 4,500 USD support and trendline, bullish targets may be invalidated.
Key Observations
1. Trendline – Price is following a strong ascending trendline, showing bullish momentum.
2. Support Zone – Around 4,500 – 4,600 USD (highlighted yellow/blue box). Price is bouncing above this zone.
3. Breakout Point – A breakout occurred above the consolidation (around 4,800 USD).
4. Target Zones –
First Target: ~4,950 – 5,000 USD (first green box labeled "TARGET POINT").
Second Target: ~5,200 USD (upper green box labeled "TARGET POINT").
Target Projection
Immediate Target: ~4,950 – 5,000 USD
Extended Target: ~5,200 USD if momentum continues and price holds above support.
⚠ Important: If price breaks below the 4,500 USD support and trendline, bullish targets may be invalidated.
Trade active
trade activet.me/forexofdollarsmagnet
Forex, gold and crypto signal's with detailed analysis & get consistent results..
t.me/+yJ2-qfkocRg1NDlk
Gold signal's with proper TP & SL for high profits opportunities..
Forex, gold and crypto signal's with detailed analysis & get consistent results..
t.me/+yJ2-qfkocRg1NDlk
Gold signal's with proper TP & SL for high profits opportunities..
Related publications
Disclaimer
The information and publications are not meant to be, and do not constitute, financial, investment, trading, or other types of advice or recommendations supplied or endorsed by TradingView. Read more in the Terms of Use.
t.me/forexofdollarsmagnet
Forex, gold and crypto signal's with detailed analysis & get consistent results..
t.me/+yJ2-qfkocRg1NDlk
Gold signal's with proper TP & SL for high profits opportunities..
Forex, gold and crypto signal's with detailed analysis & get consistent results..
t.me/+yJ2-qfkocRg1NDlk
Gold signal's with proper TP & SL for high profits opportunities..
Related publications
Disclaimer
The information and publications are not meant to be, and do not constitute, financial, investment, trading, or other types of advice or recommendations supplied or endorsed by TradingView. Read more in the Terms of Use.