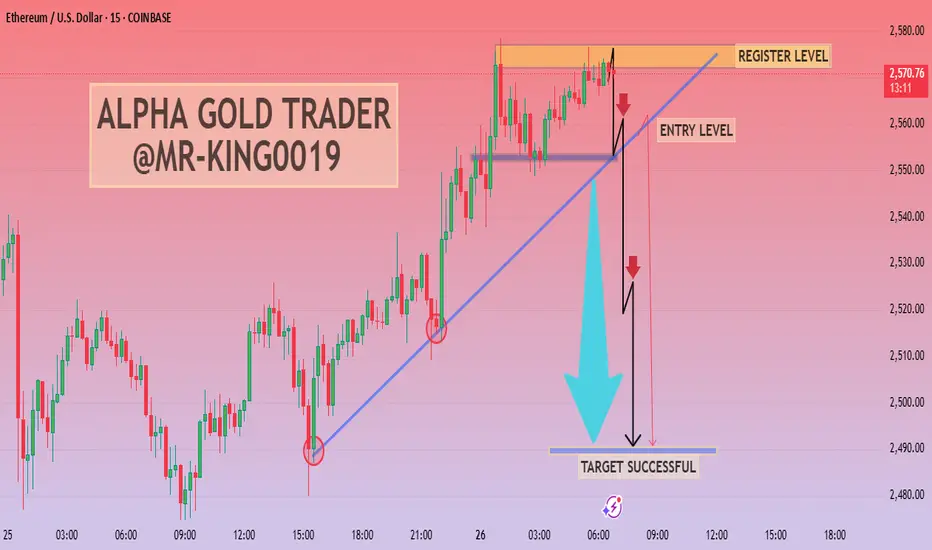
The chart you've shared is a 15-minute candlestick chart for Ethereum (ETH/USD) on Coinbase, showing a technical analysis scenario with these elements:
1. Ascending Trendline: ETH was in an upward trend, as indicated by the blue support line connecting higher lows.
2. Register Level: Around the $2,575–$2,578 zone, this is identified as a resistance area where price reversed.
3. Entry Level: Just below the trendline around $2,560, marked as the suggested sell (short) entry after the breakdown.
4. Bearish Breakdown: Price broke below the trendline and entry level, triggering a sell signal.
5. Target Successful: The projected downside move (highlighted with the blue arrow) hit the target area near $2,485–$2,490, indicating a successful short trade.
This is a classic trendline break and retest short setup, often used in day trading strategies. The chart suggests the trader took a short position after the trendline broke and targeted the previous support zone, with the move playing out as expected. Let me know if you’d like help interpreting this for future trades or if you want a similar analysis for another chart.
Disclaimer
The information and publications are not meant to be, and do not constitute, financial, investment, trading, or other types of advice or recommendations supplied or endorsed by TradingView. Read more in the Terms of Use.
Disclaimer
The information and publications are not meant to be, and do not constitute, financial, investment, trading, or other types of advice or recommendations supplied or endorsed by TradingView. Read more in the Terms of Use.