Pattern Overview
Technical Analysis
Elliott Wave Structure
Timing Analysis (Neely Method)
Price Projection Methods
Key Levels & Targets
Trading Strategy
Market Context
Action Plan
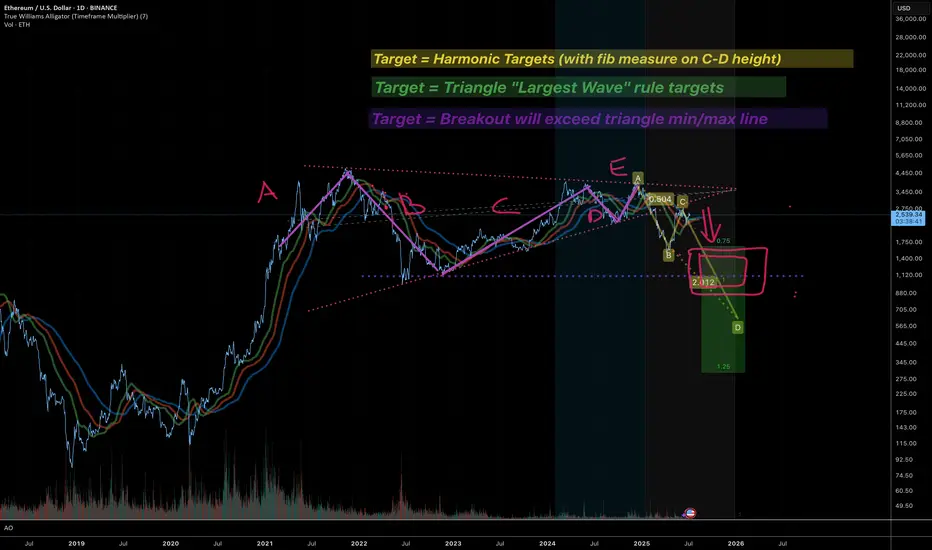
- Textbook five-wave contracting triangle (A-B-C-D-E) fully formed
- Price compressed between converging trendlines – coiled spring ready to release
- Volume steadily declining into apex – classic pre-breakout signature
- Multiple indicators point to downside resolution
Technical Analysis
Elliott Wave Structure
- Clean 3-3-3-3-3 corrective sequence confirmed
- All waves respect triangle rules: C < A, D < B, E < C
- Converging boundaries create pressure for explosive move
Timing Analysis (Neely Method)
- Triangles complete within 60-80% of A-to-apex timespan
- ETH now sits directly in this critical window
- Resolution expected within 4-6 weeks maximum
Price Projection Methods
- Largest Wave Rule: Thrust often equals biggest internal leg → Target: $1,350 then $900
- Minimum Line Rule: Must exceed lowest triangle point (~$880) for valid thrust
- Fibonacci Extension: 0.75-1.25x of C-D height → Extended targets: $750-$300
Key Levels & Targets
- Support Break: Pink trendline (see chart)
- Initial Target Zone: $1,200-$900
- Extended Targets: $600-$300 if momentum builds
- Invalidation: Close above upper resistance line
Trading Strategy
- Entry: Daily close below rising support line
- Target 1: $1,200-$900 (confluence zone)
- Target 2: $600-$300 (1.25 fib extension)
- Stop Loss: Re-entry into triangle after breakdown
- Risk Management: Small position size, use trailing stops, monitor ETF flows
Market Context
- Triangle maturity suggests imminent resolution
- Volume expansion will confirm breakout direction
- Watch for macro catalysts that could accelerate move
- ETF decisions and regulatory news remain wildcards
Action Plan
- Triangle has exhausted time – breakout window is NOW
- Technical evidence strongly favors downside
- Wait for clean break with volume confirmation
- Prepare for potential cascade to three-digit prices
- Stay disciplined – let the market prove the direction
Disclaimer
The information and publications are not meant to be, and do not constitute, financial, investment, trading, or other types of advice or recommendations supplied or endorsed by TradingView. Read more in the Terms of Use.
Disclaimer
The information and publications are not meant to be, and do not constitute, financial, investment, trading, or other types of advice or recommendations supplied or endorsed by TradingView. Read more in the Terms of Use.