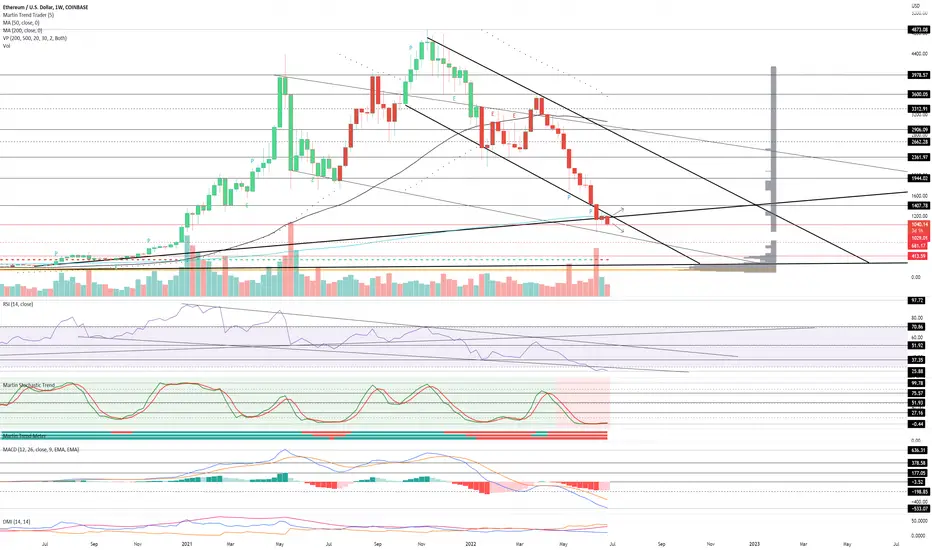
ETHUSD Daily cautiously bearish. Recommended ratio: 10% ETH, 90% Cash. *It's currently a risk-off market which is adversely impacting cryptos and equities, add the insolvency crisis that is currently hitting various crypto lenders and crypto investment funds and there are very few reasons to be bullish. Once lay-offs are more commonplace and the housing market sees a prolonged shock, maybe then financial markets will have priced in a recession; but as it looks now, there is still a bit of room for downward pressure.* Price is currently trending down at $1018 as it attempts to stay above $1k, it is also breaking down below two important trendlines (which happen to coincide with the 200 MA); the lower trendline of the descending channel from October 2021 and the uptrend line from June 2020 (both at ~$1200). Though we are technically exhausted on the Weekly and starting to be the Monthly, there is still room for a bit more downward pressure (the lower trendline of the descending channel from May 2021 is at ~$800 and the long-term uptrend line from January 2017 is at ~$300). Volume is Moderate (low) and is currently favoring sellers after breaking the eleven-week seller-dominant streak for one week in last week's session. Parabolic SAR flips bullish at $3550, this margin is bullish. RSI is currently trending down at 26.69 as it quickly approaches a retest of the ATL at 25.88. Stochastic remains Flatlined at max bottom for a seventh consecutive week; the longer this goes on, the higher the odds of a massive rally in the future. MACD remains bearish and continues to form new ATLs with no signs of trough formation, the newest ATL is currently at -533. ADX is currently trending up slightly at 32 as Price continues to fall, this is bearish. If Price is able to bounce here and reclaim both the uptrend line from June 2020 and the lower trendline of the descending channel from October 2021 at ~$1200, then the next likely target is a test of $1407 resistance. However, if Price is to break down below $1k support, it will likely test the lower trendline of the descending channel from May 2021 at ~$800 before potentially heading lower to test $681 minor support for the first time since breaking above it in December 2020. Mental Stop Loss: (two consecutive closes above) $1245.
Disclaimer
The information and publications are not meant to be, and do not constitute, financial, investment, trading, or other types of advice or recommendations supplied or endorsed by TradingView. Read more in the Terms of Use.
Disclaimer
The information and publications are not meant to be, and do not constitute, financial, investment, trading, or other types of advice or recommendations supplied or endorsed by TradingView. Read more in the Terms of Use.