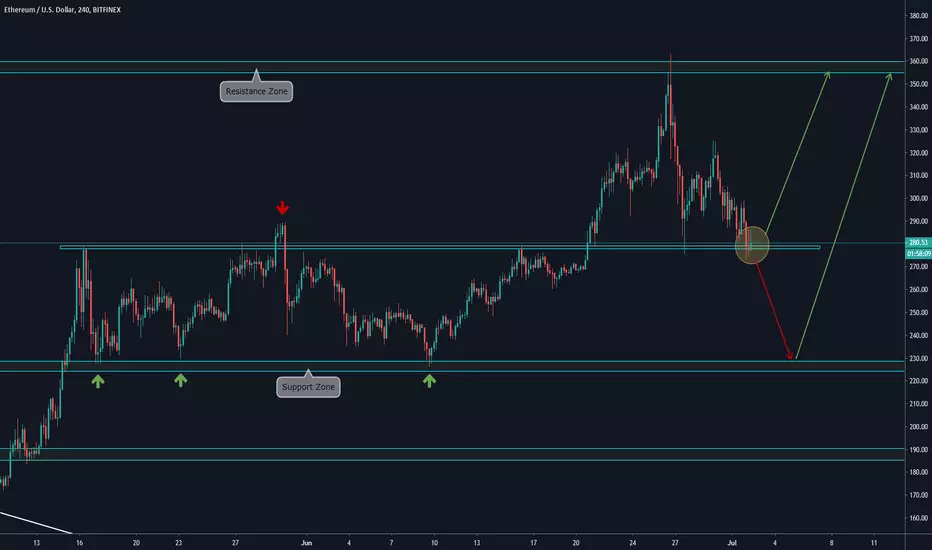
4H CHART EXPLANATION:
At this moment price is facing a support zone (previous resistance zone) that holded the price many times before breaking upwards. So, it is a nice reversal point for Ethereum, and to place a long trade it would be safe to wait for a price action confirmation such a candlestich pattern.
In case this level can not hold the price correctly, we expect another downside movement towards the lower Support Zone at 230-240 and a bounce from there.
MULTI TIMEFRAME VISION:
-Daily:

-Weekly:

At this moment price is facing a support zone (previous resistance zone) that holded the price many times before breaking upwards. So, it is a nice reversal point for Ethereum, and to place a long trade it would be safe to wait for a price action confirmation such a candlestich pattern.
In case this level can not hold the price correctly, we expect another downside movement towards the lower Support Zone at 230-240 and a bounce from there.
MULTI TIMEFRAME VISION:
-Daily:
-Weekly:
Disclaimer
The information and publications are not meant to be, and do not constitute, financial, investment, trading, or other types of advice or recommendations supplied or endorsed by TradingView. Read more in the Terms of Use.
Disclaimer
The information and publications are not meant to be, and do not constitute, financial, investment, trading, or other types of advice or recommendations supplied or endorsed by TradingView. Read more in the Terms of Use.