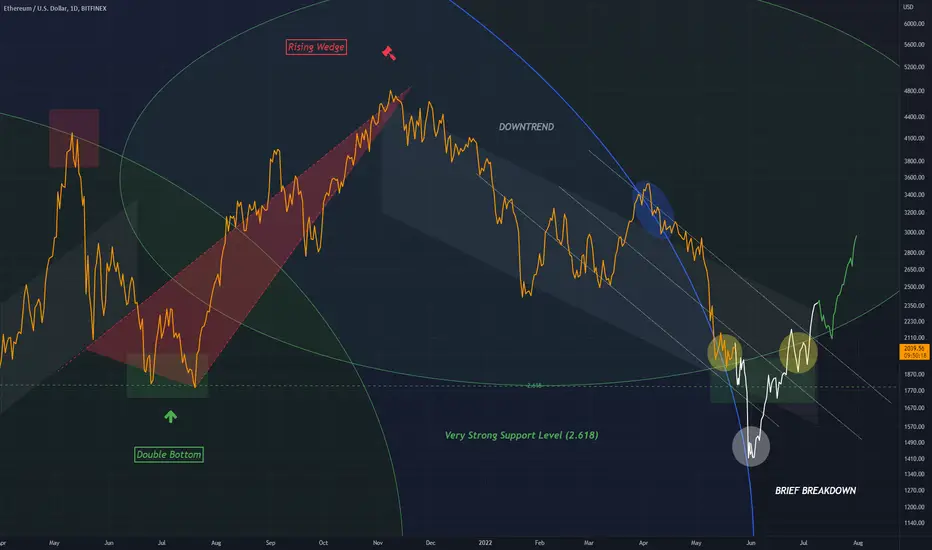
Price has almost reached the 2.618 level of a major Fibonacci circle area
As price reaches this level within the apparent downtrend, a breakdown may ensue vertically along the blue circle
After this event a prompt recover will follow, and this is when I believe the bulls will return in force.
Trend line drawn horizontally against 2.618 shows a double bottom formation which further emphasizes a bull rejection
Other patterns on the chart include a Rising Wedge which shows a clear top point
Price (bars pattern) placed around the 2.618 area are just estimations, the main takeaway is a recovery at 2.618.
Daily chart
I am long Ethereum
Disclaimer
The information and publications are not meant to be, and do not constitute, financial, investment, trading, or other types of advice or recommendations supplied or endorsed by TradingView. Read more in the Terms of Use.
Disclaimer
The information and publications are not meant to be, and do not constitute, financial, investment, trading, or other types of advice or recommendations supplied or endorsed by TradingView. Read more in the Terms of Use.