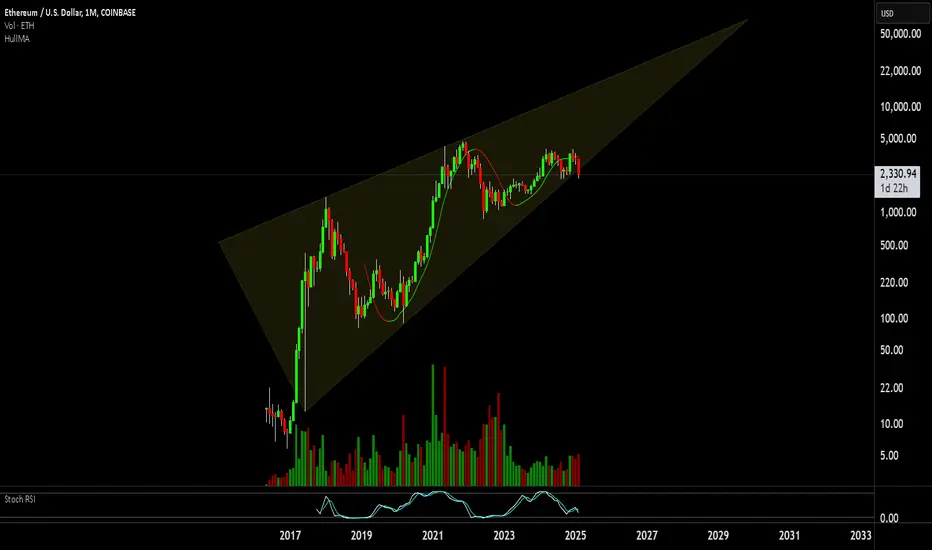
Ethereum in all-time rising wedge, now borderline falling out and breakdown to a disastrous level...
Note
The 30-Day Hull Moving Average has now flipped bearish on the Monthly Chart with the most recent price action having pierced the lower trend line...
A bullish case, and the saving grace for ETH here, is that it is also moving within an Ascending Triangle with the lower line also being pierced here...
Back to the bearish scenario, price has been forming an Ascending Broadening Wedge over the last 2 years with price breaking down out of the formation with the recent move...
Note
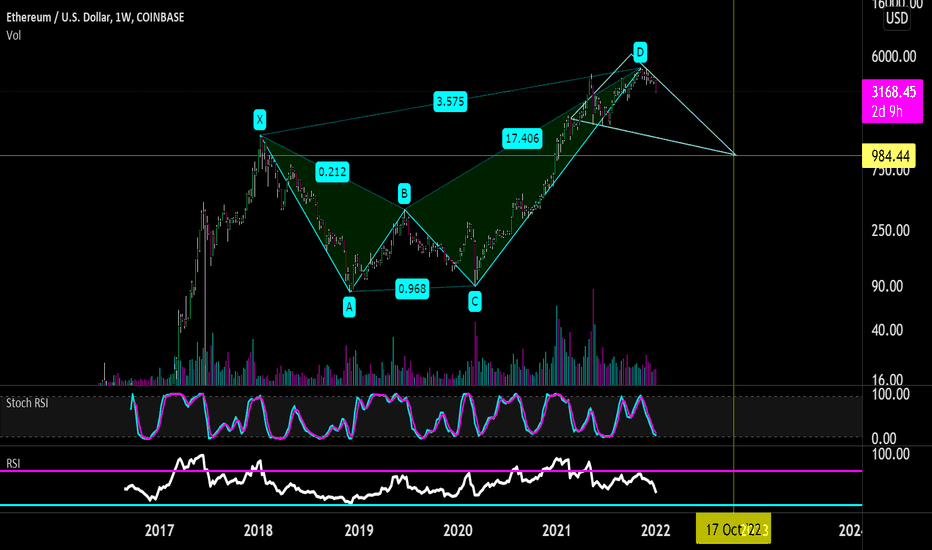
Mustering some bullish hopium, I could see a recovery attempt leading to the completion of a Harmonic pattern in the hope to retest the ATH, after which--if the harmonic is completed--ETH will see a price decline after its formation with a retest of the support of the lower trendline of the Ascending Broadening Wedge, if the ATH is not definitively broken and support is created and held above $4900.
Note
Why would I even think a Harmonic Pattern would play out here?Note
Because Harmonics have been a theme for Ethereum...
Note
I have called these patterns previously on Ethereum as well, as the same for TSLA, LINK, and BTC. The ratios do not need to be exact for them to play out, just the general pattern.
Note
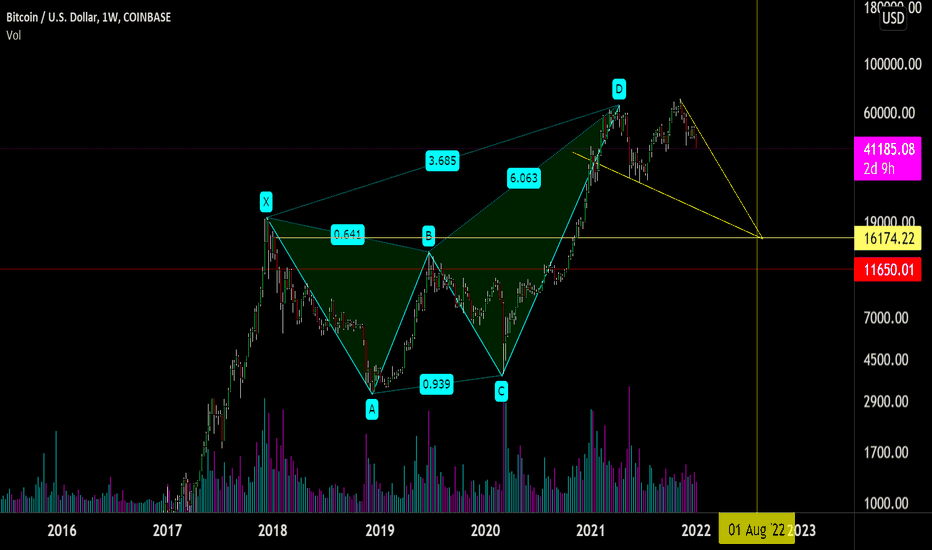
BTC here in July of 2022...
Note
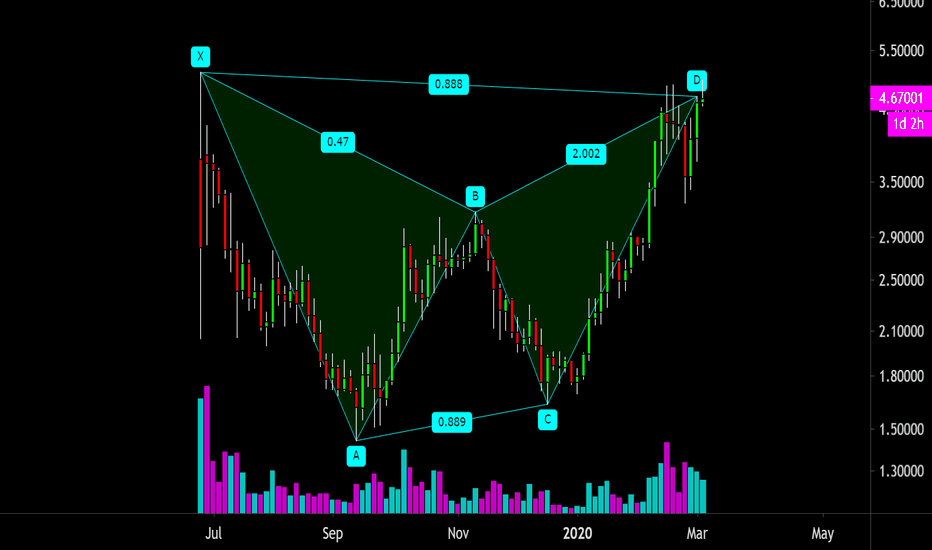
Link in March of 2020
Note
Regardless, without reclaiming the lower trendlines of the Wedges and Triangles then Ethereum could likely breakdown to $1950-$1700...below that is $984 and with it a multi-year bear market at the very least.
I will be updating this as things progress.
Note
A shot of the Daily for perspective.
Note
And should it reclaim and the Bull Market continue with price moving within the Rising Wedge then we should see $24,000 ETH by sometime in 2027.
Note
Price broke down for a lower local low with Stochastic RSI resetting once again...
Note
Bullish Divergence on the 1H chart forming...
Note
Slight Bullish Divergence forming on the Daily. Best possible hope here is for today's candle to form a Green Hammer...
With Price gaining at least 15% over the next 3 days to close the week with a strong wick...
This will allow for the 30-Day HullMA to catch up and the Stochastic to build bullish momentum at the bottom which is currently at the bottom at 5.80...
Note
At the close of the week of February 2, 2025 price spiked up 21% moving back within the major Ascending Triangle...
Note
Note
I will continue adding to this thread as time progresses but will cover this slide in a new Idea dedicated just to this Ascending Broadening Wedge...
Note
Bottom line...hold here or short to the Measure Rule target at $1075 ETH.
Note
Failed to hold the support line with a massive Bearish Engulfing candle on the Daily
Note
Currently watching this potential Diamond Bottom forming. It does have the corresponding volume profile for the pattern...
Would be looking for high-er volume on the breakout. This pattern has a 13% failure rate with a typical rise of 15%-35%, with a 43& chance of Throwbacks...
This pattern does not invalidate the Ascending Broadening Wedge until a clear break of the Wedge's lower trendline is held
Note
for more Bullish narrative we have a potential Inverse Head & Shoulders forming along with the Diamond Bottom pattern...and...
...as well as a Bullish Gartley on the Daily...
Note
Bullish formation narratives are invalidated. Expecting to see the $1000 ETH from here. Any upward movements are to be considered shorting opportunities.
Note
At the lower trendline of the Ascending Wedge with the 50Day HMA flipped bear on the Monthly
Disclaimer
The information and publications are not meant to be, and do not constitute, financial, investment, trading, or other types of advice or recommendations supplied or endorsed by TradingView. Read more in the Terms of Use.
Disclaimer
The information and publications are not meant to be, and do not constitute, financial, investment, trading, or other types of advice or recommendations supplied or endorsed by TradingView. Read more in the Terms of Use.