Ethereum (ETH/USD) Technical Insights
**Chart Overview**
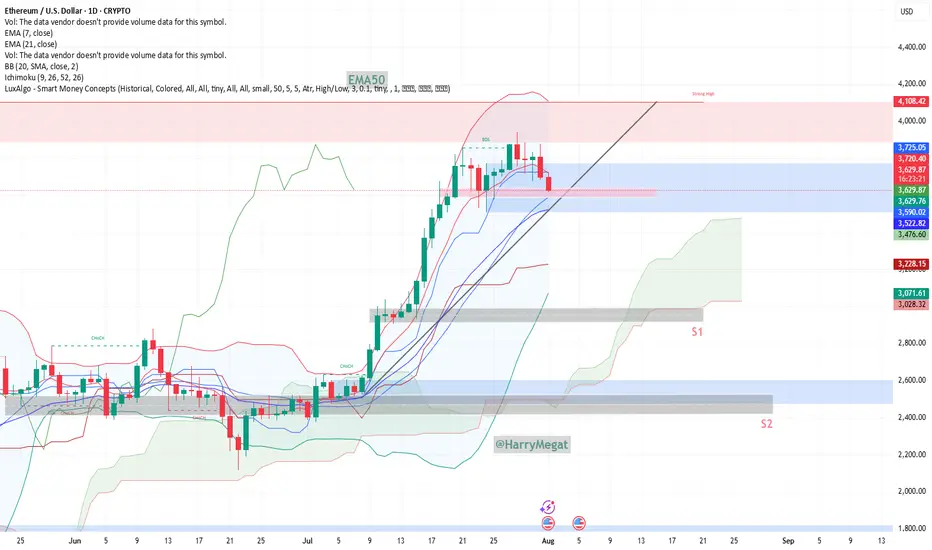
* **Current Price**: \~\$3,631
* **EMA 7 (Red Line)**: \$3,720.80
* **EMA 21 (Blue Line)**: \$3,522.96
* **Key Support Zone (Pink area)**: \~\$3,600–\$3,650
* **Support 1 (S1)**: \~\$2,950
* **Support 2 (S2)**: \~\$2,500
* **Uptrend Line**: Still intact, but under pressure
**Technical Insights**
* **Price Breakdown**: ETH has dropped below the **EMA 7**, and is now testing a **critical horizontal support zone** around **\$3,600–\$3,650**.
* **Trendline**: Still holds, but ETH is **hovering just above it**, signaling a potential bounce or breakdown.
* **EMA 21** near \$3,522 is the next short-term support if \$3,600 fails.
* **Momentum**: Recent candles show **strong selling**, indicating weakness, but no full breakdown yet.
**Bullish Scenario**
*Conditions**:
* Price **holds above** \$3,600–\$3,620 zone and the **trendline**
* **Bounce** with bullish daily candle from current zone or above \$3,650
**Buy Setup**:
* **Entry**: \$3,620–\$3,650 on confirmation
* **Stop-loss**: Below \$3,520 (just under EMA 21)
* **Targets**:
* TP1: \$3,720 (reclaim EMA 7)
* TP2: \$3,850–\$3,940
* TP3: \$4,100+
**Bearish Scenario**
**Conditions**:
* Price **breaks below** \$3,600 and **the trendline**
* EMA 21 is lost with strong bearish candle
**Sell Setup**:
* **Entry**: Below \$3,580 on breakdown
* **Stop-loss**: Above \$3,650
* **Targets**:
* TP1: \$3,520 (EMA 21)
* TP2: \$2,950 (S1)
* TP3: \$2,500 (S2)
**Bias: Neutral with Bearish Lean**
* **Decision Zone**: ETH is at a key inflection point
* Wait for **confirmation**: bounce or breakdown before entering

**Chart Overview**
* **Current Price**: \~\$3,631
* **EMA 7 (Red Line)**: \$3,720.80
* **EMA 21 (Blue Line)**: \$3,522.96
* **Key Support Zone (Pink area)**: \~\$3,600–\$3,650
* **Support 1 (S1)**: \~\$2,950
* **Support 2 (S2)**: \~\$2,500
* **Uptrend Line**: Still intact, but under pressure
**Technical Insights**
* **Price Breakdown**: ETH has dropped below the **EMA 7**, and is now testing a **critical horizontal support zone** around **\$3,600–\$3,650**.
* **Trendline**: Still holds, but ETH is **hovering just above it**, signaling a potential bounce or breakdown.
* **EMA 21** near \$3,522 is the next short-term support if \$3,600 fails.
* **Momentum**: Recent candles show **strong selling**, indicating weakness, but no full breakdown yet.
**Bullish Scenario**
*Conditions**:
* Price **holds above** \$3,600–\$3,620 zone and the **trendline**
* **Bounce** with bullish daily candle from current zone or above \$3,650
**Buy Setup**:
* **Entry**: \$3,620–\$3,650 on confirmation
* **Stop-loss**: Below \$3,520 (just under EMA 21)
* **Targets**:
* TP1: \$3,720 (reclaim EMA 7)
* TP2: \$3,850–\$3,940
* TP3: \$4,100+
**Bearish Scenario**
**Conditions**:
* Price **breaks below** \$3,600 and **the trendline**
* EMA 21 is lost with strong bearish candle
**Sell Setup**:
* **Entry**: Below \$3,580 on breakdown
* **Stop-loss**: Above \$3,650
* **Targets**:
* TP1: \$3,520 (EMA 21)
* TP2: \$2,950 (S1)
* TP3: \$2,500 (S2)
**Bias: Neutral with Bearish Lean**
* **Decision Zone**: ETH is at a key inflection point
* Wait for **confirmation**: bounce or breakdown before entering
Disclaimer
The information and publications are not meant to be, and do not constitute, financial, investment, trading, or other types of advice or recommendations supplied or endorsed by TradingView. Read more in the Terms of Use.
Disclaimer
The information and publications are not meant to be, and do not constitute, financial, investment, trading, or other types of advice or recommendations supplied or endorsed by TradingView. Read more in the Terms of Use.