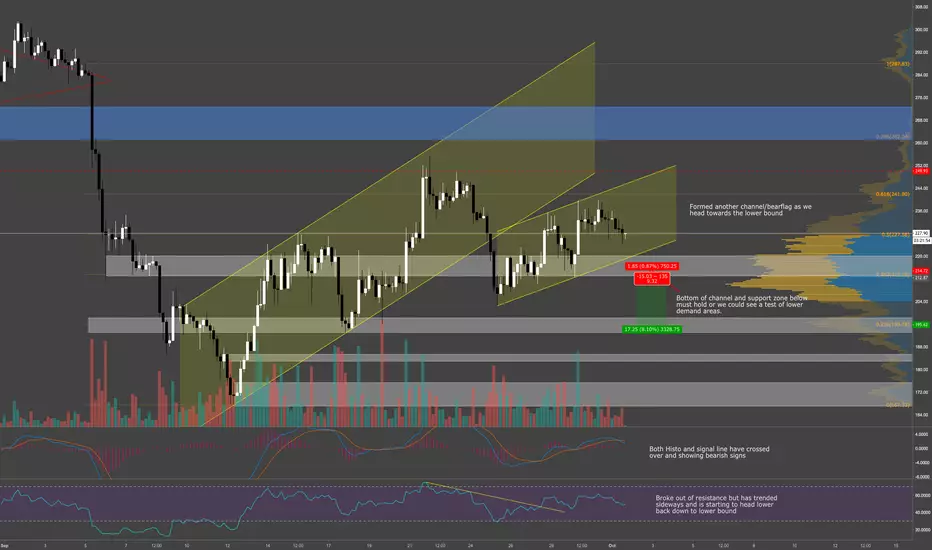
Ethereum has formed another channel/bearflag after breaking below the previous channel and is currently heading towards the lower trendline. One could also argue, but we never recommend drawing out patterns before they are completed, that we are currently forming a H&S pattern on this trend upwards, which if formed could cause a drop back down to the lower demand zone around $170. Obviously, this means nothing until the formation is complete and until then just something to keep in mind.
MACD has turned bearish on both metrics while RSI failed to reach previous high on the latest move up further indicating we may have fizzled out. If we were to break down, a possible trade would be a break of this demand zone and taking a short position on the retest and failure of this S/R flip zone. Targets could be the 23.6%FIB level as well as the lower demand zones if you feel that ETH is very weak once we break!
However, we are currently finding support at the 50%FIB level and could spring up from here if we can hold!
Thanks guys!
Note
Ethereum continues to trend sideways along the FIB level using it as support while maintaining the midline of the channel. MACD continues to crossover lower but RSI remains flat so far. Awaiting some volatility to enter the market and until then.....just sit on your hands!
Disclaimer
The information and publications are not meant to be, and do not constitute, financial, investment, trading, or other types of advice or recommendations supplied or endorsed by TradingView. Read more in the Terms of Use.
Disclaimer
The information and publications are not meant to be, and do not constitute, financial, investment, trading, or other types of advice or recommendations supplied or endorsed by TradingView. Read more in the Terms of Use.