https://tradingview.sweetlogin.com/x/SPumSWUO/
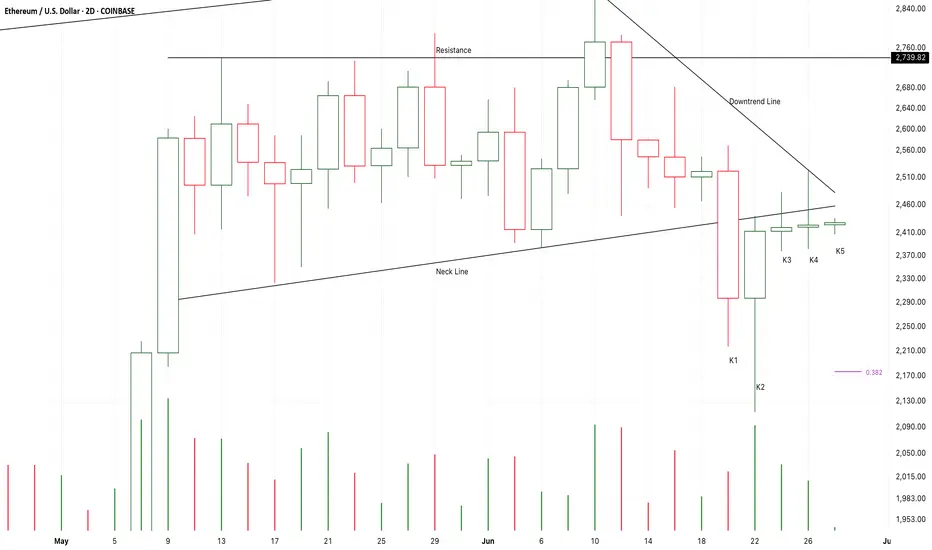
K2 verified a potential fake down of K1.
And,the supply pressure near the neck line keep decreasing.
It seems that K6 will choose to break up or fall down.
If the following candles close upon the neck line,
I will try to buy in.
If the following candles close below K3,
The risk will sharply increase.
Long-2388/Stop-2345/Target-2800
Long-2420/Stop-2345/Target-2800
Long-2488/Stop-2345/Target-2800
Disclaimer
The information and publications are not meant to be, and do not constitute, financial, investment, trading, or other types of advice or recommendations supplied or endorsed by TradingView. Read more in the Terms of Use.
Disclaimer
The information and publications are not meant to be, and do not constitute, financial, investment, trading, or other types of advice or recommendations supplied or endorsed by TradingView. Read more in the Terms of Use.