The Perfect Storm: Multiple Technical Indicators Align for ETH's Next Leg Up
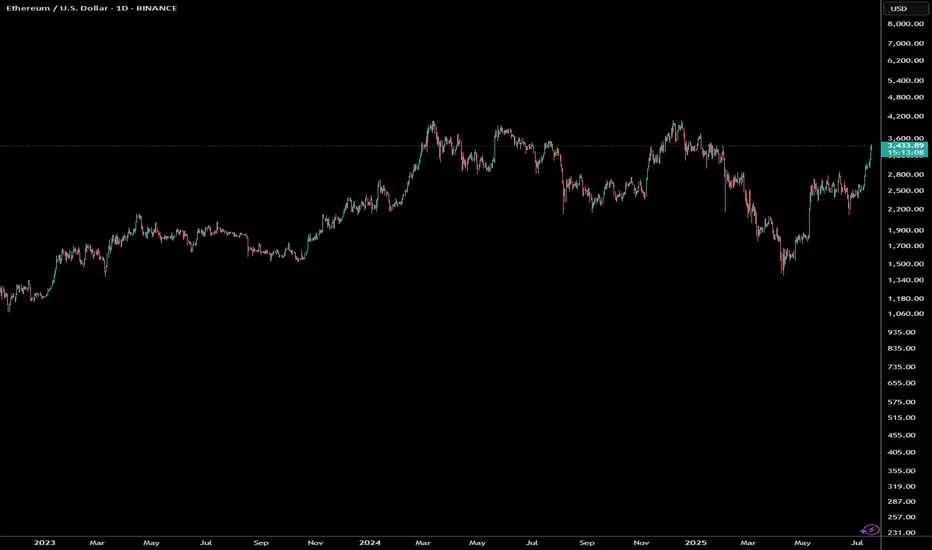
With Ethereum currently trading at $3,429, a comprehensive multi-faceted technical analysis reveals compelling evidence for continued bullish momentum through the remainder of 2025. Let's dive into the convergence of powerful technical signals pointing to ETH's next major move.
RSI: Hidden Strength Behind the Momentum
While Ethereum's daily RSI hovers around 72-73, typically considered overbought territory, this actually represents strength rather than exhaustion in a powerful bull trend. Historical analysis shows that during Ethereum's strongest rallies, RSI can maintain readings above 70 for extended periods, often reaching 80-85 before meaningful corrections.
The weekly RSI at 66 is particularly telling—showing robust momentum without reaching extreme levels. This creates the perfect scenario: strong enough to maintain upward pressure, yet not overheated enough to trigger immediate profit-taking. This "Goldilocks zone" for RSI often precedes the most explosive phases of bull markets.
Wyckoff Accumulation: The Smart Money Footprint
The recent price action perfectly aligns with Wyckoff's "Re-accumulation After Spring" pattern:
The May 2025 low represented a classic "Spring" that flushed out weak hands
The subsequent rally formed a textbook "Sign of Strength" (SOS)
We've completed the "Backup" phase with higher lows
Current price action suggests we're at the "Last Point of Support" (LPS)
According to Wyckoff methodology, this LPS typically precedes the most powerful "Mark-Up" phase—where institutional accumulation transitions to public participation and price discovery accelerates dramatically. The completion of this pattern projects a move to the $4,500-$5,000 range within the forecast period.
Order Blocks: Institutional Footprints Reveal the Path Forward
Order block analysis reveals significant institutional buying between $3,000-$3,200, creating a formidable support zone. More importantly, there's a notable absence of major selling order blocks above current levels until approximately $3,800-$4,000.
This "clean air" above current prices suggests minimal resistance and the potential for rapid price appreciation once momentum builds. The most significant buy-side order blocks have been forming during recent consolidations, indicating smart money accumulation before the next leg up.
Volume Profile: The Silent Confirmation
Volume analysis provides the confirmation needed to validate our bullish thesis:
Rising prices accompanied by increasing volume (particularly on up-days)
Volume Profile shows thin areas above $3,500, suggesting potential for rapid price discovery
The Volume-Weighted Average Price (VWAP) continues to slope upward, confirming the strength of the trend
The Volume Point of Control (VPOC) has shifted higher in recent weeks, indicating accumulation at higher prices—a classic sign of institutional confidence.
Fibonacci Projections: Mathematical Roadmap to Higher Targets
Using the recent swing low of $2,150 (May 2025) to the current level as our base measurement:
The 161.8% extension projects a target of approximately $4,200
The 200% extension suggests a move toward $4,700
The 261.8% extension (often reached in strong bull markets) points to $5,400+
What's particularly bullish is that these Fibonacci extensions align perfectly with key psychological price levels and unfilled liquidity pools above the market.
Elliott Wave Structure: The Roadmap to $5,000
The current Elliott Wave count suggests we're in the early stages of a powerful Wave 3 of 5 from the May lows:
Wave 1: $2,150 to $2,800
Wave 2: Pullback to $2,450
Wave 3: Currently underway, targeting $4,200-$4,500 (typical Wave 3 = 1.618 × Wave 1)
Wave 4: Future consolidation likely in the $3,800-$4,000 range
Wave 5: Final push potentially reaching $4,800-$5,200
Wave 3 is typically the longest and most powerful in the Elliott sequence, suggesting we're entering the most explosive phase of this bull cycle.
Price Projection Timeline
July-August 2025:
Initial push through the $3,600 resistance level, followed by accelerating momentum toward $3,800-$4,000. Any pullbacks will find strong support at $3,200, creating ideal entry opportunities for those who missed the initial breakout.
September 2025:
Breakthrough of the psychological $4,000 barrier, triggering increased media attention and retail participation. This phase could see rapid price discovery to $4,200-$4,400 as volume expands dramatically.
October-November 2025:
Final wave extension pushing ETH toward the $4,800-$5,200 range, potentially culminating in a blow-off top characteristic of Wave 5 completions. This represents a 40-50% appreciation from current levels.
The Confluence That Cannot Be Ignored
What makes this analysis particularly compelling is the rare confluence of multiple technical frameworks all pointing to the same conclusion. When Wyckoff accumulation patterns, Elliott Wave projections, Fibonacci extensions, RSI momentum, and order block analysis all align, the probability of the projected outcome increases exponentially.
Smart money is positioning for this move now, as evidenced by the order block formation and volume patterns. For the strategic investor, the current price level—despite being near recent highs—represents an attractive entry point before the next major leg up in Ethereum's journey.
The technical roadmap is clear: Ethereum is poised for a significant appreciation through the remainder of 2025, with multiple technical frameworks projecting targets in the $4,500-$5,200 range by year-end.
Discord.gg/CryptoIndicators
Disclaimer
The information and publications are not meant to be, and do not constitute, financial, investment, trading, or other types of advice or recommendations supplied or endorsed by TradingView. Read more in the Terms of Use.
Discord.gg/CryptoIndicators
Disclaimer
The information and publications are not meant to be, and do not constitute, financial, investment, trading, or other types of advice or recommendations supplied or endorsed by TradingView. Read more in the Terms of Use.