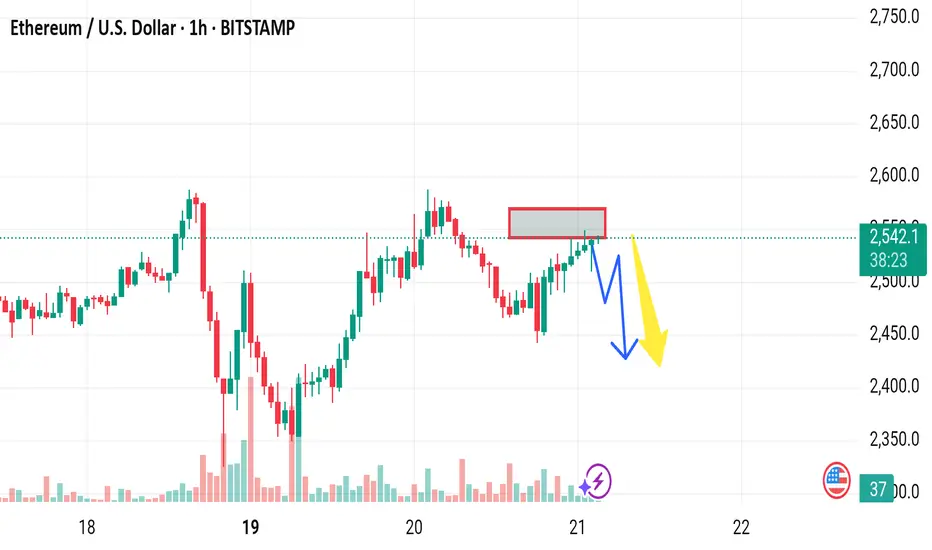
Disruptive (Contrarian/Bullish) View:
1. Higher Lows Formation:
The price is consistently forming higher lows, which could indicate building bullish momentum, not weakness.
This could suggest a breakout attempt through the resistance zone rather than a rejection.
2. Volume Analysis:
Volume seems to be stabilizing (and even increasing slightly) on green candles approaching resistance.
This might indicate accumulation rather than distribution — a possible prelude to a bullish breakout.
3. Short-term Bull Flag/Pennant:
The price pattern just before entering the red box may resemble a bull flag, a continuation pattern.
If it breaks the flag upwards, it could target levels around $2,600+.
4. Failed Bearish Setups:
The earlier sharp drop was quickly recovered, showing buyer interest below $2,500.
This invalidates the strength of previous selling pressure.
5. Psychological Level at $2,500 Holding:
ETH is hovering just above the key $2,500 psychological support.
Holding above this level increases the likelihood of testing and potentially flipping resistance to support.
t.me/gold_free_signals1
𝙁𝙤𝙧𝙚𝙭 𝙩𝙧𝙖𝙙𝙞𝙣𝙜 𝙚𝙭𝙥𝙚𝙧𝙞𝙚𝙣𝙘𝙚 𝙩𝙚𝙖𝙢 ☺️ 𝙢𝙖𝙣𝙖𝙜𝙚 𝙮𝙤𝙪𝙧 𝙖𝙘𝙘𝙤𝙪𝙣𝙩 𝙢𝙖𝙠𝙞𝙣𝙜 𝙢𝙤𝙣𝙚𝙮 🤑💰
t.me/gold_free_signals1
𝙁𝙤𝙧𝙚𝙭 𝙩𝙧𝙖𝙙𝙞𝙣𝙜 𝙚𝙭𝙥𝙚𝙧𝙞𝙚𝙣𝙘𝙚 𝙩𝙚𝙖𝙢 ☺️ 𝙢𝙖𝙣𝙖𝙜𝙚 𝙮𝙤𝙪𝙧 𝙖𝙘𝙘𝙤𝙪𝙣𝙩 𝙢𝙖𝙠𝙞𝙣𝙜 𝙢𝙤𝙣𝙚𝙮 🤑💰
t.me/gold_free_signals1
Disclaimer
The information and publications are not meant to be, and do not constitute, financial, investment, trading, or other types of advice or recommendations supplied or endorsed by TradingView. Read more in the Terms of Use.
t.me/gold_free_signals1
𝙁𝙤𝙧𝙚𝙭 𝙩𝙧𝙖𝙙𝙞𝙣𝙜 𝙚𝙭𝙥𝙚𝙧𝙞𝙚𝙣𝙘𝙚 𝙩𝙚𝙖𝙢 ☺️ 𝙢𝙖𝙣𝙖𝙜𝙚 𝙮𝙤𝙪𝙧 𝙖𝙘𝙘𝙤𝙪𝙣𝙩 𝙢𝙖𝙠𝙞𝙣𝙜 𝙢𝙤𝙣𝙚𝙮 🤑💰
t.me/gold_free_signals1
𝙁𝙤𝙧𝙚𝙭 𝙩𝙧𝙖𝙙𝙞𝙣𝙜 𝙚𝙭𝙥𝙚𝙧𝙞𝙚𝙣𝙘𝙚 𝙩𝙚𝙖𝙢 ☺️ 𝙢𝙖𝙣𝙖𝙜𝙚 𝙮𝙤𝙪𝙧 𝙖𝙘𝙘𝙤𝙪𝙣𝙩 𝙢𝙖𝙠𝙞𝙣𝙜 𝙢𝙤𝙣𝙚𝙮 🤑💰
t.me/gold_free_signals1
Disclaimer
The information and publications are not meant to be, and do not constitute, financial, investment, trading, or other types of advice or recommendations supplied or endorsed by TradingView. Read more in the Terms of Use.