Ethereum
Long

ETHUSD / crypto-winter Fibonacci correlation

140
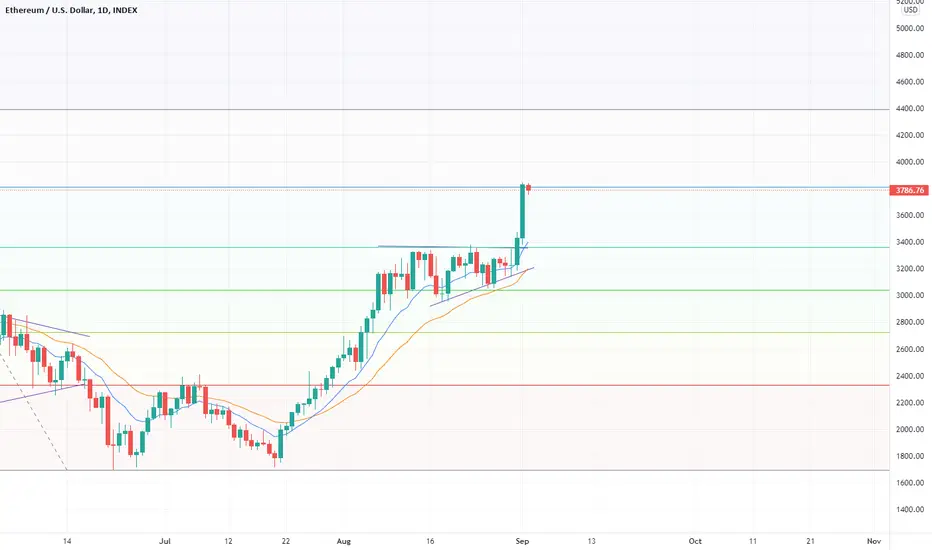
ETHUSD followed some Fibonacci levels for the crash. I drew a Fibonacci retracement starting with the ATH, zeroing at the bottom of the crash. Note how the first bounce occurred between the .382 and .236 levels and focused in a symmetric triangle into the channel they form, before crashing down to the zero line. It channeled sideways, forming a bottoming pattern between the .236 and 0 line, before the EMAs and MACD crossed and formed the latest uptrend. Note the resistance at the .618, and the channel formed between the .618 and .5 lines. Unsurprisingly given this tendency, today's 1D candle bounced right of the .786 line. This is perhaps indicative of resistance now at the .786 line ($3,813), and the channel will form between it and the .618 line. That would make $3,360 the new support price for this consolidation if it were to occur.

Disclaimer

The information and publications are not meant to be, and do not constitute, financial, investment, trading, or other types of advice or recommendations supplied or endorsed by TradingView. Read more in the Terms of Use.